

1873 National Association Earned Run Average Leaders
Earned runs allowed per nine innings
Cherokee Fisher led the National Association in earned run average in 1873 with 1.81, 0.77 ahead of Bobby Mathews (2.58). It was one of 2 times Cherokee Fisher led in earned run average.
Showing pitchers with at least 52.0 innings — the standard 1.0 inning per team game. Show all players
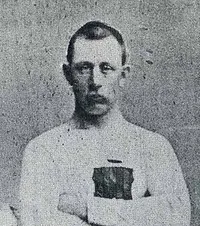 Led the NA in 1873
Cherokee Fisher
Philadelphia Athletics
1.81
Earned Run Average
0.77 clear of Bobby Mathews
Showing Earned Run Average and the stats that give it context
Full stat line
| # | Player | Team | ERA | W | L | IP | WHIP |
|---|---|---|---|---|---|---|---|
| 1 |
 Cherokee Fisher |
PH1 | 1.81 | 3 | 4 | 84.1 | 1.19 |
| 2 |
 Bobby Mathews |
NY2 | 2.58 | 29 | 23 | 443.0 | 1.24 |
| 3 |
 Candy Cummings |
BL1 | 2.80 | 28 | 14 | 382.0 | 1.33 |
| 4 |
 George Zettlein |
PH2 | 2.86 | 36 | 15 | 460.0 | 1.38 |
| 5 | Hugh Campbell | ELI | 2.95 | 2 | 16 | 165.0 | 1.57 |
| 6 |
 Al Spalding |
BS1 | 2.99 | 41 | 14 | 496.2 | 1.37 |
| 7 | McDoolan | BL4 | 3.00 | 0 | 1 | 9.0 | 2.00 |
| 8 |
 Dick McBride |
PH1 | 3.34 | 24 | 19 | 382.2 | 1.31 |
| 9 | Jim Britt | BR2 | 4.08 | 17 | 36 | 480.2 | 1.53 |
| 10 |
 Asa Brainard |
BL1 | 4.14 | 5 | 7 | 108.2 | 1.76 |
| 11 | Bill Stearns | WS5 | 4.61 | 7 | 25 | 283.0 | 1.76 |
| 12 | Frank Fleet | ELI | 5.25 | 0 | 3 | 24.0 | 2.38 |
| 13 | John Greason | WS5 | 5.86 | 1 | 6 | 63.0 | 1.95 |
| 14 | Frank Sellman | BL4 | 8.00 | 0 | 1 | 9.0 | 2.33 |
| 15 | Ed Stratton | BL4 | 8.33 | 0 | 3 | 27.0 | 2.81 |
| 16 | Bill French | BL4 | 12.00 | 0 | 1 | 9.0 | 3.33 |