

1875 National Association Strikeouts / 9 Leaders
Strikeouts per nine innings
Jack Manning led the National Association in strikeouts / 9 in 1875 with 2.12, 0.33 ahead of Tommy Bond (1.79).
Showing pitchers with at least 82.0 innings — the standard 1.0 inning per team game. Show all players
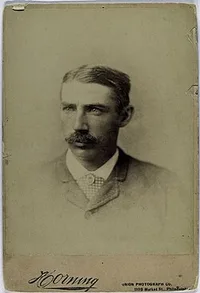 Led the NA in 1875
Jack Manning
Boston Red Stockings
2.12
Strikeouts / 9
0.33 clear of Tommy Bond
Showing Strikeouts / 9 and the stats that give it context
Full stat line
| # | Player | Team | K/9 | W | L | ERA | IP |
|---|---|---|---|---|---|---|---|
| 1 |
 Jack Manning |
BS1 | 2.12 | 16 | 2 | 2.38 | 144.0 |
| 2 |
 Tommy Bond |
HR1 | 1.79 | 19 | 16 | 1.41 | 352.0 |
| 3 |
 Candy Cummings |
HR1 | 1.77 | 35 | 12 | 1.60 | 416.0 |
| 4 |
 Tricky Nichols |
NH1 | 1.50 | 4 | 29 | 2.38 | 288.0 |
| 5 | Pidgey Morgan | SL1 | 1.50 | 1 | 3 | 1.29 | 42.0 |
| 6 |
 Mike Golden |
CH2 +1 | 1.32 | 7 | 19 | 1.86 | 232.0 |
| 7 |
 Lon Knight |
PH1 | 1.26 | 6 | 5 | 2.27 | 107.0 |
| 8 |
 Al Spalding |
BS1 | 1.18 | 54 | 5 | 1.59 | 570.2 |
| 9 |
 Bobby Mathews |
NY2 | 1.08 | 29 | 38 | 2.49 | 625.2 |
| 10 |
 George Bradley |
SL2 | 1.01 | 33 | 26 | 2.13 | 535.2 |
| 11 |
 Joe Blong |
SL1 | 0.98 | 3 | 12 | 3.07 | 129.0 |
| 12 |
 Jim Devlin |
CH2 | 0.92 | 7 | 16 | 1.93 | 224.0 |
| 13 | Harry Luff | NH1 | 0.66 | 1 | 6 | 3.28 | 68.2 |
| 14 |
 George Zettlein |
CH2 +1 | 0.60 | 29 | 22 | 1.59 | 463.1 |
| 15 |
 Jim Clinton |
BR2 | 0.51 | 1 | 13 | 2.41 | 123.0 |
| 16 |
 George Bechtel |
PH3 +1 | 0.50 | 5 | 13 | 2.67 | 162.0 |
| 17 |
 Dick McBride |
PH1 | 0.45 | 44 | 14 | 2.33 | 538.0 |
| 18 |
 Cherokee Fisher |
PH2 | 0.45 | 22 | 19 | 1.99 | 358.0 |
| 19 |
 John Cassidy |
BR2 | 0.38 | 1 | 21 | 3.03 | 213.2 |
| 20 |
 Bill Parks |
WS6 +1 | 0.24 | 4 | 8 | 3.54 | 112.0 |
| 21 | Bill Stearns | WS6 | 0.19 | 1 | 14 | 4.02 | 141.0 |
| 22 |
 Johnny Ryan |
NH1 | 0.15 | 1 | 5 | 3.19 | 59.1 |