
1952-1953 NBA True Shooting Percentage Leaders
Shooting efficiency including free throws
Ed Macauley led the NBA in true shooting percentage with 54.3% in the 1952-1953 season, 0.9 percentage points ahead of Neil Johnston (53.4%). It was one of 2 times Ed Macauley led in true shooting percentage.
Showing players who met the games-played minimum for the season. Show all players
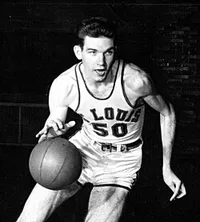 Led the NBA in 1952-1953
Ed Macauley
BOS
54.3%
True Shooting Percentage
0.9% clear of Neil Johnston
Showing True Shooting Percentage and the stats that give it context
Full stat line
| # | Player | Team | TS% | GP | FGM | FGA | FG% |
|---|---|---|---|---|---|---|---|
| 1 |
 Ed Macauley |
BOS | 54.3% | 69 | 451 | 997 | 45.2% |
| 2 |
 Neil Johnston |
PHW | 53.4% | 70 | 504 | 1,114 | 45.2% |
| 3 |
 Arnie Johnson |
ROC | 53.3% | 70 | 140 | 369 | 37.9% |
| 4 |
 Harry Gallatin |
NYK | 52.5% | 70 | 282 | 635 | 44.4% |
| 5 |
 Bill Sharman |
BOS | 52.1% | 71 | 403 | 925 | 43.6% |
| 6 |
 Vern Mikkelsen |
MNL | 50.4% | 70 | 378 | 868 | 43.5% |
| 7 |
 Ernie Vandeweghe |
NYK | 49.9% | 61 | 272 | 625 | 43.5% |
| 8 |
 Carl Braun |
NYK | 49.7% | 70 | 323 | 807 | 40.0% |
| 9 |
 Charlie Share |
FTW | 49.6% | 67 | 91 | 254 | 35.8% |
| 10 |
 Dolph Schayes |
SYR | 49.5% | 71 | 375 | 1,002 | 37.4% |
| 11 | Odie Spears | ROC | 49.5% | 62 | 198 | 494 | 40.1% |
| 12 |
 Bob Donham |
BOS | 49.2% | 71 | 169 | 353 | 47.9% |
| 13 |
 Slater Martin |
MNL | 48.9% | 70 | 260 | 634 | 41.0% |
| 14 |
 Paul Seymour |
SYR | 48.5% | 67 | 306 | 798 | 38.3% |
| 15 |
 George Mikan |
MNL | 48.0% | 70 | 500 | 1,252 | 39.9% |
| 16 |
 Don Henriksen |
BAL | 47.9% | 68 | 199 | 475 | 41.9% |
| 17 |
 George King |
SYR | 47.9% | 71 | 255 | 635 | 40.2% |
| 18 |
 Bobby Wanzer |
ROC | 47.5% | 70 | 318 | 866 | 36.7% |
| 19 |
 Bob Davies |
ROC | 47.4% | 66 | 339 | 880 | 38.5% |
| 20 |
 Andy Phillip |
FTW | 47.4% | 70 | 250 | 629 | 39.7% |
| 21 | Don Meineke | FTW | 47.2% | 68 | 240 | 630 | 38.1% |
| 22 |
 Al McGuire |
NYK | 46.9% | 58 | 112 | 287 | 39.0% |
| 23 |
 Red Rocha |
SYR | 46.6% | 69 | 268 | 690 | 38.8% |
| 24 |
 Dick Groat |
FTW | 46.4% | 26 | 100 | 272 | 36.8% |
| 25 | Bob Lavoy | INO | 46.4% | 70 | 225 | 560 | 40.2% |
| 26 |
 Connie Simmons |
NYK | 46.3% | 65 | 240 | 637 | 37.7% |
| 27 | Bob Harris | BOS | 46.3% | 70 | 192 | 459 | 41.8% |
| 28 | Frank Saul | MNL | 46.2% | 70 | 187 | 471 | 39.7% |
| 29 | Jim Baechtold | BAL | 45.5% | 64 | 242 | 621 | 39.0% |
| 30 | Jack Coleman | ROC | 45.4% | 70 | 314 | 748 | 42.0% |
| 31 | Johnny Payak | MIH | 45.2% | 68 | 128 | 373 | 34.3% |
| 32 |
 Max Zaslofsky |
NYK | 45.0% | 29 | 123 | 320 | 38.4% |
| 33 | Dillard Crocker | MIH | 44.9% | 61 | 100 | 284 | 35.2% |
| 34 |
 Paul Walther |
INO | 44.8% | 67 | 227 | 645 | 35.2% |
| 35 |
 Larry Foust |
FTW | 44.8% | 67 | 311 | 865 | 36.0% |
| 36 |
 Don Barksdale |
BAL | 44.7% | 65 | 321 | 829 | 38.7% |
| 37 |
 Arnie Risen |
ROC | 44.6% | 68 | 295 | 802 | 36.8% |
| 38 |
 Bob Cousy |
BOS | 44.6% | 71 | 464 | 1,320 | 35.2% |
| 39 |
 Dick McGuire |
NYK | 44.5% | 61 | 142 | 373 | 38.1% |
| 40 | Ray Lumpp | BAL | 44.3% | 55 | 188 | 506 | 37.2% |
| 41 | Nelson Bobb | PHW | 44.1% | 55 | 119 | 318 | 37.4% |
| 42 |
 Billy Gabor |
SYR | 43.8% | 69 | 215 | 614 | 35.0% |
| 43 | Frank Brian | FTW | 43.8% | 68 | 245 | 699 | 35.1% |
| 44 | Paul Hoffman | BAL | 43.6% | 69 | 240 | 656 | 36.6% |
| 45 |
 Joe Graboski |
INO | 43.6% | 69 | 272 | 799 | 34.0% |
| 46 | Freddie Scolari | FTW | 43.6% | 62 | 277 | 809 | 34.2% |
| 47 |
 Don Boven |
FTW | 43.5% | 67 | 153 | 427 | 35.8% |
| 48 |
 Vince Boryla |
NYK | 43.5% | 66 | 254 | 686 | 37.0% |
| 49 | George Ratkovicz | MIH | 43.3% | 71 | 208 | 619 | 33.6% |
| 50 | Jack Kerris | BAL | 43.1% | 69 | 93 | 256 | 36.3% |
1–50 of 88Next →