

1964-1965 NBA Effective FG Percentage Leaders
Field goal percentage weighting threes
Wilt Chamberlain led the NBA in effective fg percentage with 51.0% in the 1964-1965 season, 0.1 percentage points ahead of Walt Bellamy (50.9%). It was one of 9 times Wilt Chamberlain led in effective fg percentage.
Showing players who met the games-played minimum for the season. Show all players
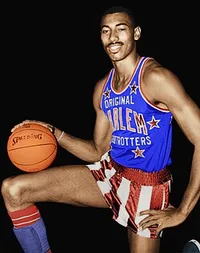 Led the NBA in 1964-1965
Wilt Chamberlain
SFW
51.0%
Effective FG Percentage
0.1% clear of Walt Bellamy
Showing Effective FG Percentage and the stats that give it context
Full stat line
| # | Player | Team | eFG% | GP | FGM | FGA | FG% |
|---|---|---|---|---|---|---|---|
| 1 |
 Wilt Chamberlain |
SFW | 51.0% | 73 | 1,063 | 2,083 | 51.0% |
| 2 |
 Walt Bellamy |
BLT | 50.9% | 80 | 733 | 1,441 | 50.9% |
| 3 |
 Jerry Lucas |
CIN | 49.8% | 66 | 558 | 1,121 | 49.8% |
| 4 |
 Jerry West |
LAL | 49.7% | 74 | 822 | 1,655 | 49.7% |
| 5 |
 Bailey Howell |
BLT | 49.5% | 80 | 515 | 1,040 | 49.5% |
| 6 |
 Terry Dischinger |
DET | 49.3% | 80 | 568 | 1,153 | 49.3% |
| 7 |
 Zelmo Beaty |
STL | 48.2% | 80 | 505 | 1,047 | 48.2% |
| 8 |
 Oscar Robertson |
CIN | 48.0% | 75 | 807 | 1,681 | 48.0% |
| 9 |
 Paul Neumann |
SFW | 47.3% | 76 | 365 | 772 | 47.3% |
| 10 |
 Johnny Green |
NYK | 46.9% | 78 | 346 | 737 | 46.9% |
| 11 |
 Rudy LaRusso |
LAL | 46.1% | 77 | 381 | 827 | 46.1% |
| 12 |
 Wayne Embry |
CIN | 45.6% | 74 | 352 | 772 | 45.6% |
| 13 |
 Adrian Smith |
CIN | 45.6% | 80 | 463 | 1,016 | 45.6% |
| 14 |
 Sam Jones |
BOS | 45.2% | 80 | 821 | 1,818 | 45.2% |
| 15 |
 Richie Guerin |
STL | 44.6% | 57 | 295 | 662 | 44.6% |
| 16 |
 Larry Costello |
PHL | 44.5% | 64 | 309 | 695 | 44.5% |
| 17 |
 Leroy Ellis |
LAL | 44.4% | 80 | 311 | 700 | 44.4% |
| 18 |
 Jack Twyman |
CIN | 44.3% | 80 | 479 | 1,081 | 44.3% |
| 19 |
 Eddie Miles |
DET | 44.2% | 76 | 439 | 994 | 44.2% |
| 20 |
 Bob Boozer |
NYK | 44.0% | 80 | 424 | 963 | 44.0% |
| 21 |
 Don Ohl |
BLT | 43.8% | 77 | 568 | 1,297 | 43.8% |
| 22 |
 Bill Russell |
BOS | 43.8% | 78 | 429 | 980 | 43.8% |
| 23 |
 Cliff Hagan |
STL | 43.6% | 77 | 393 | 901 | 43.6% |
| 24 |
 Hal Greer |
PHL | 43.3% | 70 | 539 | 1,245 | 43.3% |
| 25 |
 Willis Reed |
NYK | 43.2% | 80 | 629 | 1,457 | 43.2% |
| 26 |
 Thomas Sanders |
BOS | 42.9% | 80 | 374 | 871 | 42.9% |
| 27 |
 Bob Pettit |
STL | 42.9% | 50 | 396 | 923 | 42.9% |
| 28 |
 Rod Thorn |
DET | 42.7% | 74 | 320 | 750 | 42.7% |
| 29 |
 Dave DeBusschere |
DET | 42.5% | 79 | 508 | 1,196 | 42.5% |
| 30 | Jim Barnes | NYK | 42.4% | 75 | 454 | 1,070 | 42.4% |
| 31 | Kevin Loughery | BLT | 42.4% | 80 | 406 | 957 | 42.4% |
| 32 | Charles Vaughn | STL | 42.4% | 75 | 344 | 811 | 42.4% |
| 33 |
 Nate Thurmond |
SFW | 41.9% | 77 | 519 | 1,240 | 41.9% |
| 34 |
 Gus Johnson |
BLT | 41.8% | 76 | 577 | 1,379 | 41.8% |
| 35 |
 Lenny Wilkens |
STL | 41.4% | 78 | 434 | 1,048 | 41.4% |
| 36 |
 Lucious Jackson |
PHL | 41.4% | 76 | 419 | 1,013 | 41.4% |
| 37 |
 Dick Barnett |
LAL | 41.3% | 74 | 375 | 908 | 41.3% |
| 38 |
 Dave Gambee |
PHL | 41.2% | 80 | 356 | 864 | 41.2% |
| 39 | Reggie Harding | DET | 41.0% | 78 | 405 | 987 | 41.0% |
| 40 |
 Chet Walker |
PHL | 40.3% | 79 | 377 | 936 | 40.3% |
| 41 |
 John Havlicek |
BOS | 40.1% | 75 | 570 | 1,420 | 40.1% |
| 42 |
 Elgin Baylor |
LAL | 40.1% | 74 | 763 | 1,903 | 40.1% |
| 43 |
 Tom Meschery |
SFW | 39.4% | 79 | 361 | 917 | 39.4% |
| 44 |
 Bill Bridges |
STL | 38.6% | 79 | 362 | 938 | 38.6% |
| 45 |
 Willie Naulls |
BOS | 38.4% | 71 | 302 | 786 | 38.4% |
| 46 |
 Tom Heinsohn |
BOS | 38.3% | 67 | 365 | 954 | 38.3% |
| 47 |
 Guy Rodgers |
SFW | 38.0% | 79 | 465 | 1,225 | 38.0% |
| 48 |
 Howard Komives |
NYK | 37.4% | 80 | 381 | 1,020 | 37.4% |
| 49 | Ray Scott | DET | 36.8% | 66 | 402 | 1,092 | 36.8% |