

2001-2002 NBA True Shooting Percentage Leaders
Shooting efficiency including free throws
Brent Barry led the NBA in true shooting percentage with 65.2% in the 2001-2002 season, 0.7 percentage points ahead of Jon Barry (64.5%). It was one of 4 times Brent Barry led in true shooting percentage.
Showing players who met the games-played minimum for the season. Show all players
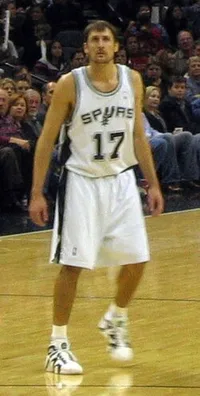 Led the NBA in 2001-2002
Brent Barry
SEA
65.2%
True Shooting Percentage
0.7% clear of Jon Barry
Showing True Shooting Percentage and the stats that give it context
Full stat line
| # | Player | Team | TS% | GP | FGM | FGA | FG% |
|---|---|---|---|---|---|---|---|
| 1 |
 Brent Barry |
SEA | 65.2% | 81 | 401 | 790 | 50.8% |
| 2 |
 Jon Barry |
DET | 64.5% | 82 | 255 | 522 | 48.9% |
| 3 |
 Jamaal Magloire |
CHH | 62.4% | 82 | 228 | 414 | 55.1% |
| 4 |
 Reggie Miller |
IND | 61.7% | 79 | 414 | 913 | 45.3% |
| 5 |
 Steve Nash |
DAL | 60.2% | 82 | 525 | 1,088 | 48.3% |
| 6 |
 John Stockton |
UTA | 60.1% | 82 | 401 | 775 | 51.7% |
| 7 |
 Eric Piatkowski |
LAC | 60.1% | 71 | 207 | 471 | 43.9% |
| 8 |
 Kelvin Cato |
HOU | 59.9% | 75 | 190 | 326 | 58.3% |
| 9 |
 Dirk Nowitzki |
DAL | 59.9% | 76 | 600 | 1,258 | 47.7% |
| 10 |
 Ray Allen |
MIL | 59.8% | 69 | 530 | 1,148 | 46.2% |
| 11 |
 Peja Stojakovic |
SAC | 59.2% | 71 | 547 | 1,130 | 48.4% |
| 12 |
 Scot Pollard |
SAC | 59.0% | 80 | 197 | 358 | 55.0% |
| 13 |
 Shaquille O'Neal |
LAL | 59.0% | 67 | 712 | 1,229 | 57.9% |
| 14 |
 Wesley Person |
CLE | 58.9% | 78 | 467 | 944 | 49.5% |
| 15 |
 Steven Smith |
SAS | 58.8% | 77 | 310 | 682 | 45.5% |
| 16 |
 Elton Brand |
LAC | 58.6% | 80 | 532 | 1,010 | 52.7% |
| 17 |
 Michael Redd |
MIL | 58.1% | 67 | 294 | 609 | 48.3% |
| 18 |
 Wally Szczerbiak |
MIN | 58.0% | 82 | 609 | 1,200 | 50.8% |
| 19 |
 Doug Christie |
SAC | 57.8% | 81 | 338 | 735 | 46.0% |
| 20 |
 Tim Duncan |
SAS | 57.6% | 82 | 764 | 1,504 | 50.8% |
| 21 |
 Monty Williams |
ORL | 57.5% | 68 | 198 | 362 | 54.7% |
| 22 |
 Dikembe Mutombo |
PHI | 57.4% | 80 | 321 | 641 | 50.1% |
| 23 |
 Brad Miller |
IND | 57.2% | 76 | 366 | 733 | 49.9% |
| 24 |
 Joe Smith |
MIN | 57.1% | 72 | 297 | 581 | 51.1% |
| 25 |
 Tony Battie |
BOS | 57.0% | 74 | 211 | 390 | 54.1% |
| 26 |
 Paul Pierce |
BOS | 57.0% | 82 | 707 | 1,598 | 44.2% |
| 27 | Zeljko Rebraca | DET | 56.9% | 74 | 189 | 374 | 50.5% |
| 28 | Scott Padgett | UTA | 56.8% | 75 | 188 | 395 | 47.6% |
| 29 | Aaron Williams | NJN | 56.8% | 82 | 231 | 439 | 52.6% |
| 30 | Chris Whitney | WAS | 56.8% | 82 | 274 | 656 | 41.8% |
| 31 |
 Chucky Atkins |
DET | 56.8% | 79 | 368 | 790 | 46.6% |
| 32 |
 Ruben Patterson |
POR | 56.7% | 75 | 319 | 619 | 51.5% |
| 33 |
 Corliss Williamson |
DET | 56.7% | 78 | 411 | 806 | 51.0% |
| 34 |
 Othella Harrington |
NYK | 56.7% | 77 | 237 | 450 | 52.7% |
| 35 |
 Pau Gasol |
MEM | 56.6% | 82 | 551 | 1,064 | 51.8% |
| 36 |
 Donyell Marshall |
UTA | 56.5% | 58 | 343 | 661 | 51.9% |
| 37 |
 Rashard Lewis |
SEA | 56.4% | 71 | 455 | 972 | 46.8% |
| 38 |
 Gilbert Arenas |
GSW | 56.2% | 47 | 174 | 384 | 45.3% |
| 39 | Todd MacCulloch | NJN | 56.2% | 62 | 247 | 465 | 53.1% |
| 40 |
 David Robinson |
SAS | 56.2% | 78 | 341 | 672 | 50.7% |
| 41 |
 Corey Maggette |
LAC | 56.0% | 63 | 235 | 530 | 44.3% |
| 42 | Rodney Rogers | BOS | 55.8% | 77 | 356 | 756 | 47.1% |
| 43 |
 Terry Porter |
SAS | 55.8% | 72 | 136 | 321 | 42.4% |
| 44 |
 Alonzo Mourning |
MIA | 55.8% | 75 | 447 | 866 | 51.6% |
| 45 |
 Elden Campbell |
CHH | 55.8% | 77 | 384 | 794 | 48.4% |
| 46 | Lucious Harris | NJN | 55.6% | 74 | 249 | 537 | 46.4% |
| 47 |
 Chauncey Billups |
MIN | 55.5% | 82 | 348 | 823 | 42.3% |
| 48 |
 Pat Garrity |
ORL | 55.3% | 80 | 327 | 767 | 42.6% |
| 49 |
 Darrell Armstrong |
ORL | 55.3% | 82 | 347 | 828 | 41.9% |
| 50 |
 Andrei Kirilenko |
UTA | 55.3% | 82 | 285 | 633 | 45.0% |
1–50 of 246Next →