

2007-2008 NBA Points per Game Leaders
Points scored per game
LeBron James led the NBA in points per game with 30.0 in the 2007-2008 season, 1.7 ahead of Kobe Bryant (28.3). It stands 85th among all single seasons in NBA history.
Showing players who met the games-played minimum for the season. Show all players
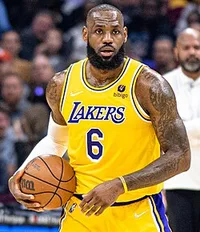 Led the NBA in 2007-2008
LeBron James
CLE
30.0
Points per Game
1.7 clear of Kobe Bryant
Showing Points per Game and the stats that give it context
Full stat line
| # | Player | Team | PPG | GP | MPG | PTS |
|---|---|---|---|---|---|---|
| 1 |
 LeBron James |
CLE | 30.0 | 75 | 40.4 | 2,250 |
| 2 |
 Kobe Bryant |
LAL | 28.3 | 82 | 38.9 | 2,323 |
| 3 |
 Allen Iverson |
DEN | 26.4 | 82 | 41.8 | 2,164 |
| 4 |
 Carmelo Anthony |
DEN | 25.7 | 77 | 36.4 | 1,978 |
| 5 |
 Amar'e Stoudemire |
PHX | 25.2 | 79 | 33.9 | 1,989 |
| 6 |
 Kevin Martin |
SAC | 23.7 | 61 | 36.3 | 1,443 |
| 7 |
 Dirk Nowitzki |
DAL | 23.6 | 77 | 36.0 | 1,817 |
| 8 |
 Michael Redd |
MIL | 22.7 | 72 | 37.5 | 1,632 |
| 9 |
 Richard Jefferson |
NJN | 22.6 | 82 | 39.0 | 1,857 |
| 10 |
 Chris Bosh |
TOR | 22.3 | 67 | 36.2 | 1,496 |
| 11 |
 Corey Maggette |
LAC | 22.1 | 70 | 35.7 | 1,547 |
| 12 |
 Baron Davis |
GSW | 21.8 | 82 | 39.0 | 1,791 |
| 13 |
 Jason Richardson |
CHA | 21.8 | 82 | 38.4 | 1,788 |
| 14 |
 Joe Johnson |
ATL | 21.7 | 82 | 40.8 | 1,779 |
| 15 |
 Tracy McGrady |
HOU | 21.6 | 66 | 37.0 | 1,427 |
| 16 |
 Antawn Jamison |
WAS | 21.4 | 79 | 38.7 | 1,689 |
| 17 |
 Vince Carter |
NJN | 21.3 | 76 | 38.9 | 1,622 |
| 18 |
 Carlos Boozer |
UTA | 21.1 | 81 | 34.9 | 1,708 |
| 19 |
 Chris Paul |
NOH | 21.1 | 80 | 37.6 | 1,684 |
| 20 |
 Al Jefferson |
MIN | 21.0 | 82 | 35.6 | 1,726 |
| 21 |
 Dwight Howard |
ORL | 20.7 | 82 | 37.7 | 1,695 |
| 22 |
 David West |
NOH | 20.6 | 76 | 37.8 | 1,564 |
| 23 |
 Jamal Crawford |
NYK | 20.6 | 80 | 39.9 | 1,645 |
| 24 |
 Caron Butler |
WAS | 20.3 | 58 | 39.9 | 1,180 |
| 25 |
 Kevin Durant |
SEA | 20.3 | 80 | 34.6 | 1,624 |
| 26 |
 Monta Ellis |
GSW | 20.2 | 81 | 37.9 | 1,636 |
| 27 |
 Rudy Gay |
MEM | 20.1 | 81 | 37.0 | 1,632 |
| 28 |
 Stephen Jackson |
GSW | 20.1 | 73 | 39.1 | 1,466 |
| 29 |
 Josh Howard |
DAL | 19.9 | 76 | 36.3 | 1,513 |
| 30 |
 Andre Iguodala |
PHI | 19.9 | 82 | 39.5 | 1,630 |
| 31 |
 Paul Pierce |
BOS | 19.6 | 80 | 35.9 | 1,570 |
| 32 |
 Danny Granger |
IND | 19.6 | 80 | 36.0 | 1,567 |
| 33 |
 Hedo Turkoglu |
ORL | 19.5 | 82 | 36.9 | 1,602 |
| 34 |
 Manu Ginobili |
SAS | 19.5 | 74 | 31.1 | 1,442 |
| 35 |
 Gerald Wallace |
CHA | 19.4 | 62 | 38.3 | 1,200 |
| 36 |
 Tim Duncan |
SAS | 19.3 | 78 | 34.0 | 1,508 |
| 37 |
 Brandon Roy |
POR | 19.1 | 74 | 37.7 | 1,416 |
| 38 |
 Mike Dunleavy |
IND | 19.1 | 82 | 36.0 | 1,565 |
| 39 |
 Pau Gasol |
LAL | 18.9 | 66 | 35.6 | 1,246 |
| 40 |
 Deron Williams |
UTA | 18.8 | 82 | 37.3 | 1,545 |
| 41 |
 Kevin Garnett |
BOS | 18.8 | 71 | 32.8 | 1,337 |
| 42 |
 Tony Parker |
SAS | 18.8 | 69 | 33.5 | 1,295 |
| 43 |
 Ben Gordon |
CHI | 18.6 | 72 | 31.8 | 1,336 |
| 44 |
 Rashard Lewis |
ORL | 18.2 | 81 | 38.0 | 1,476 |
| 45 |
 LaMarcus Aldridge |
POR | 17.8 | 76 | 34.9 | 1,350 |
| 46 |
 Zach Randolph |
NYK | 17.6 | 69 | 32.5 | 1,217 |
| 47 |
 Ray Allen |
BOS | 17.4 | 73 | 35.9 | 1,273 |
| 48 |
 Richard Hamilton |
DET | 17.3 | 72 | 33.7 | 1,244 |
| 49 |
 Mo Williams |
MIL | 17.2 | 66 | 36.5 | 1,137 |
| 50 |
 Josh Smith |
ATL | 17.2 | 81 | 35.5 | 1,394 |
1–50 of 259Next →