

1970 NFL Yards per Attempt Leaders
Passing yards per attempt
Craig Morton led the NFL in yards per attempt with 8.79 in 1970, 0.55 ahead of Bob Griese (8.24). It stands 55th among all single seasons in NFL history. It was one of 3 times Craig Morton led in yards per attempt.
Showing players who met 14 pass attempts per team game. Show all players
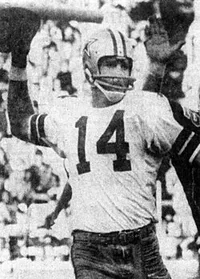 Led the whole NFL in 1970
Craig Morton
DAL
8.79
Yards per Attempt
0.55 clear of Bob Griese
Showing Yards per Attempt and the stats that give it context
Full stat line
| # | Player | Team | Y/A | G | ATT | YDS | TD |
|---|---|---|---|---|---|---|---|
| 1 |
 Craig Morton |
DAL | 8.79 | 12 | 207 | 1,819 | 15 |
| 2 |
 Bob Griese |
MIA | 8.24 | 14 | 245 | 2,019 | 12 |
| 3 | Dennis Shaw | BUF | 7.81 | 14 | 321 | 2,507 | 10 |
| 4 |
 John Brodie |
SF | 7.78 | 14 | 378 | 2,941 | 24 |
| 5 |
 John Hadl |
SD | 7.30 | 14 | 327 | 2,388 | 22 |
| 6 |
 Len Dawson |
KC | 7.16 | 14 | 262 | 1,876 | 13 |
| 7 |
 Fran Tarkenton |
NYG | 7.14 | 14 | 389 | 2,777 | 19 |
| 8 |
 Daryle Lamonica |
OAK | 7.07 | 14 | 356 | 2,516 | 22 |
| 9 |
 Sonny Jurgensen |
WAS | 6.99 | 14 | 337 | 2,354 | 23 |
| 10 |
 Norm Snead |
PHI | 6.93 | 14 | 335 | 2,323 | 15 |
| 11 |
 Jim Hart |
SLC | 6.90 | 14 | 373 | 2,575 | 14 |
| 12 |
 Johnny Unitas |
BAC | 6.89 | 14 | 321 | 2,213 | 14 |
| 13 |
 Bill Nelsen |
CLE | 6.89 | 12 | 313 | 2,156 | 16 |
| 14 |
 Bob Berry |
ATL | 6.71 | 12 | 269 | 1,806 | 16 |
| 15 |
 Gary Cuozzo |
MIN | 6.69 | 12 | 257 | 1,720 | 7 |
| 16 |
 Billy Kilmer |
NO | 6.57 | 13 | 237 | 1,557 | 6 |
| 17 |
 Terry Bradshaw |
PIT | 6.47 | 13 | 218 | 1,410 | 6 |
| 18 |
 Bart Starr |
GB | 6.45 | 14 | 255 | 1,645 | 8 |
| 19 |
 Roman Gabriel |
LAN | 6.27 | 14 | 407 | 2,552 | 16 |
| 20 |
 Virgil Carter |
CIN | 5.92 | 13 | 278 | 1,647 | 9 |
| 21 |
 Charley Johnson |
HOO | 5.88 | 10 | 281 | 1,652 | 7 |
| 22 |
 Pete Liske |
DEN | 5.63 | 11 | 238 | 1,340 | 7 |
| 23 |
 Jack Concannon |
CHI | 5.53 | 14 | 385 | 2,130 | 16 |
| 24 |
 Joe Kapp |
BOS | 5.04 | 11 | 219 | 1,104 | 3 |