

1971 AFC Net Punting Average Leaders
Net yards per punt
Don Cockroft led the AFC in net punting average in 1971 with 0.0, tied with Tom Janik.
Showing players who met 0.75 field goal attempts per team game, or 2.5 punts per team game on the punting boards. Show all players
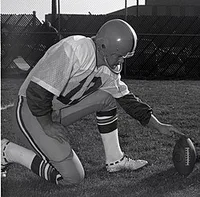 Led the AFC in 1971
Don Cockroft
CLE
0.0
Net Punting Average
Tied with Tom Janik
Showing Net Punting Average and the stats that give it context
Full stat line
| # | Player | Team | NET | G | FGM | FGA | FG% |
|---|---|---|---|---|---|---|---|
| 1 |
 Don Cockroft |
CLE | 0.0 | 14 | 15 | 28 | 53.6% |
| 2 | Tom Janik | NE | 0.0 | 14 | 0 | 0 | — |
| 3 |
 David Lee |
BAC | 0.0 | 14 | 0 | 0 | — |
| 4 | Dave Lewis | CIN | 0.0 | 14 | 0 | 0 | — |
| 5 | Steve O'Neal | NYJ | 0.0 | 14 | 0 | 0 | — |
| 6 |
 Dennis Partee |
SD | 0.0 | 14 | 17 | 29 | 58.6% |
| 7 |
 Dan Pastorini |
HOO | 0.0 | 14 | 0 | 0 | — |
| 8 |
 Larry Seiple |
MIA | 0.0 | 14 | 0 | 0 | — |
| 9 |
 Billy Van Heusen |
DEN | 0.0 | 14 | 0 | 0 | — |
| 10 |
 Bobby Walden |
PIT | 0.0 | 14 | 0 | 0 | — |
| 11 |
 Jerrel Wilson |
KC | 0.0 | 14 | 0 | 0 | — |
| 12 | Spike Jones | BUF | 0.0 | 13 | 0 | 0 | — |
| 13 | Jerry DePoyster | OAK | 0.0 | 12 | 0 | 0 | — |