

1973 NFL Touchdown Percentage Leaders
Touchdowns per pass attempt
John Hadl led the whole NFL in touchdown percentage in 1973 with 8.5%, 0.5 percentage points ahead of Roger Staubach (8.0%). It stands 24th among all single seasons in NFL history.
Showing players who met 14 pass attempts per team game. Show all players
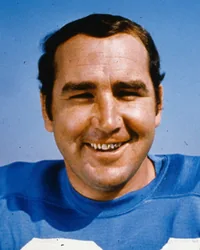 Led the whole NFL in 1973
John Hadl
LAN
8.5%
Touchdown Percentage
0.5% clear of Roger Staubach
Showing Touchdown Percentage and the stats that give it context
Full stat line
| # | Player | Team | TD% | G | ATT | YDS | TD |
|---|---|---|---|---|---|---|---|
| 1 |
 John Hadl |
LAN | 8.5% | 14 | 258 | 2,008 | 22 |
| 2 |
 Roger Staubach |
DAL | 8.0% | 14 | 286 | 2,428 | 23 |
| 3 |
 Bob Griese |
MIA | 7.8% | 13 | 218 | 1,422 | 17 |
| 4 |
 Billy Kilmer |
WAS | 6.2% | 10 | 227 | 1,656 | 14 |
| 5 |
 Charley Johnson |
DEN | 5.8% | 14 | 346 | 2,465 | 20 |
| 6 |
 Fran Tarkenton |
MIN | 5.5% | 14 | 274 | 2,113 | 15 |
| 7 |
 Ken Anderson |
CIN | 5.5% | 14 | 329 | 2,428 | 18 |
| 8 |
 Ken Stabler |
OAK | 5.4% | 14 | 260 | 1,997 | 14 |
| 9 |
 Roman Gabriel |
PHI | 5.0% | 14 | 460 | 3,219 | 23 |
| 10 |
 Jim Hart |
SLC | 4.7% | 12 | 320 | 2,223 | 15 |
| 11 | Al Woodall | NYJ | 4.5% | 9 | 201 | 1,228 | 9 |
| 12 |
 Bob Lee |
ATL | 4.3% | 12 | 230 | 1,786 | 10 |
| 13 |
 Archie Manning |
NO | 3.7% | 13 | 267 | 1,642 | 10 |
| 14 |
 Jim Plunkett |
NE | 3.5% | 14 | 376 | 2,550 | 13 |
| 15 |
 Mike Phipps |
CLE | 3.0% | 14 | 299 | 1,719 | 9 |
| 16 |
 Norm Snead |
NYG | 3.0% | 10 | 235 | 1,483 | 7 |
| 17 |
 Dan Pastorini |
HOO | 1.7% | 14 | 290 | 1,482 | 5 |