

1979 NFC Touchdown Percentage Leaders
Touchdowns per pass attempt
Roger Staubach led the NFC in touchdown percentage in 1979 with 5.9%, 0.8 percentage points ahead of Joe Theismann (5.1%).
Showing players who met 14 pass attempts per team game. Show all players
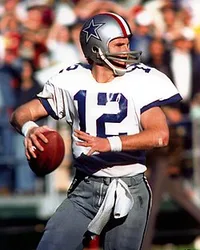 Led the NFC in 1979
Roger Staubach
DAL
5.9%
Touchdown Percentage
0.8% clear of Joe Theismann
Showing Touchdown Percentage and the stats that give it context
Full stat line
| # | Player | Team | TD% | G | ATT | YDS | TD |
|---|---|---|---|---|---|---|---|
| 1 |
 Roger Staubach |
DAL | 5.9% | 16 | 461 | 3,586 | 27 |
| 2 |
 Joe Theismann |
WAS | 5.1% | 16 | 395 | 2,797 | 20 |
| 3 |
 Phil Simms |
NYG | 4.9% | 12 | 265 | 1,743 | 13 |
| 4 |
 Ron Jaworski |
PHI | 4.8% | 16 | 374 | 2,669 | 18 |
| 5 |
 Doug Williams |
TB | 4.5% | 16 | 397 | 2,448 | 18 |
| 6 |
 Steve Bartkowski |
ATL | 4.5% | 14 | 380 | 2,505 | 17 |
| 7 |
 Tommy Kramer |
MIN | 4.1% | 16 | 566 | 3,397 | 23 |
| 8 |
 Pat Haden |
LAN | 3.8% | 10 | 290 | 1,854 | 11 |
| 9 |
 Archie Manning |
NO | 3.6% | 16 | 420 | 3,169 | 15 |
| 10 |
 Mike Phipps |
CHI | 3.5% | 12 | 255 | 1,535 | 9 |
| 11 |
 David Whitehurst |
GB | 3.1% | 13 | 322 | 2,247 | 10 |
| 12 | Jeff Komlo | DET | 3.0% | 16 | 368 | 2,238 | 11 |
| 13 |
 Steve DeBerg |
SF | 2.9% | 16 | 578 | 3,652 | 17 |
| 14 |
 Jim Hart |
SLC | 2.4% | 14 | 378 | 2,218 | 9 |