

1980 AFC Interception Percentage Leaders
Interceptions per pass attempt
Brian Sipe led the AFC in interception percentage in 1980 with 2.5%, 1.3 percentage points ahead of Steve Fuller (3.8%).
Showing players who met 14 pass attempts per team game. Show all players
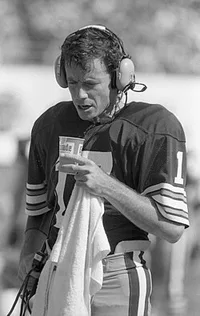 Led the AFC in 1980
Brian Sipe
CLE
2.5%
Interception Percentage
1.3% clear of Steve Fuller
Showing Interception Percentage and the stats that give it context
Full stat line
| # | Player | Team | INT% | G | ATT | YDS | TD |
|---|---|---|---|---|---|---|---|
| 1 |
 Brian Sipe |
CLE | 2.5% | 16 | 554 | 4,132 | 30 |
| 2 | Steve Fuller | KC | 3.8% | 14 | 320 | 2,250 | 10 |
| 3 |
 Dan Fouts |
SD | 4.1% | 16 | 589 | 4,715 | 30 |
| 4 |
 Jim Zorn |
SEA | 4.1% | 16 | 488 | 3,346 | 17 |
| 5 |
 Joe Ferguson |
BUF | 4.1% | 16 | 439 | 2,805 | 20 |
| 6 |
 Craig Morton |
DEN | 4.3% | 12 | 301 | 2,150 | 12 |
| 7 |
 Bert Jones |
BAC | 4.7% | 15 | 446 | 3,134 | 23 |
| 8 |
 Ken Anderson |
CIN | 4.7% | 13 | 275 | 1,778 | 6 |
| 9 |
 Jim Plunkett |
OAK | 5.0% | 13 | 320 | 2,299 | 18 |
| 10 |
 Jack Thompson |
CIN | 5.1% | 14 | 234 | 1,324 | 11 |
| 11 |
 Terry Bradshaw |
PIT | 5.2% | 15 | 424 | 3,339 | 24 |
| 12 |
 David Woodley |
MIA | 5.2% | 13 | 327 | 1,850 | 14 |
| 13 |
 Ken Stabler |
HOO | 6.1% | 16 | 457 | 3,202 | 13 |
| 14 |
 Richard Todd |
NYJ | 6.3% | 16 | 479 | 3,329 | 17 |
| 15 |
 Steve Grogan |
NE | 7.2% | 12 | 306 | 2,475 | 18 |