

1989 NFL Punting Average Leaders
Gross yards per punt
Rich Camarillo led the NFL in punting average with 43.4 in 1989, 0.1 ahead of Greg Montgomery (43.3).
Showing players who met 0.75 field goal attempts per team game, or 2.5 punts per team game on the punting boards. Show all players
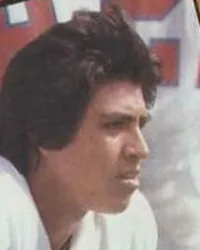 Led the whole NFL in 1989
Rich Camarillo
PHO
43.4
Punting Average
0.1 clear of Greg Montgomery
Showing Punting Average and the stats that give it context
Full stat line
| # | Player | Team | P/A | G | FGM | FGA | FG% |
|---|---|---|---|---|---|---|---|
| 1 |
 Rich Camarillo |
PHO | 43.4 | 15 | 0 | 0 | — |
| 2 |
 Greg Montgomery |
HOO | 43.3 | 16 | 0 | 0 | — |
| 3 | Jim Arnold | DET | 43.1 | 16 | 0 | 0 | — |
| 4 |
 Sean Landeta |
NYG | 43.1 | 16 | 0 | 0 | — |
| 5 | Ralf Mojsiejenko | WAS | 43.0 | 16 | 0 | 0 | — |
| 6 |
 Rohn Stark |
IND | 42.9 | 16 | 0 | 0 | — |
| 7 | Reggie Roby | MIA | 42.4 | 16 | 0 | 0 | — |
| 8 | Scott Fulhage | ATL | 41.3 | 16 | 0 | 0 | — |
| 9 | Harry Newsome | PIT | 41.1 | 16 | 0 | 0 | — |
| 10 |
 Mike Saxon |
DAL | 40.9 | 16 | 0 | 0 | — |
| 11 | Don Bracken | GB | 40.6 | 16 | 0 | 0 | — |
| 12 | Barry Helton | SF | 40.5 | 16 | 0 | 0 | — |
| 13 |
 Jeff Gossett |
LAA | 40.5 | 16 | 0 | 0 | — |
| 14 |
 Mike Horan |
DEN | 40.4 | 16 | 0 | 0 | — |
| 15 | Kelly Goodburn | KC | 40.1 | 16 | 0 | 0 | — |
| 16 |
 Hank Ilesic |
SD | 40.1 | 14 | 0 | 0 | — |
| 17 |
 Lee Johnson |
CIN | 40.1 | 16 | 0 | 0 | — |
| 18 | Ruben Rodriguez | SEA | 39.9 | 16 | 0 | 0 | — |
| 19 | Bucky Scribner | MIN | 39.8 | 15 | 0 | 0 | — |
| 20 | Tommy Barnhardt | NO | 39.6 | 11 | 0 | 0 | — |
| 21 | Maury Buford | CHI | 39.5 | 16 | 0 | 0 | — |
| 22 |
 John Kidd |
BUF | 39.4 | 16 | 0 | 0 | — |
| 23 | Chris Mohr | TB | 39.4 | 16 | 0 | 0 | — |
| 24 | John Teltschik | PHI | 39.4 | 10 | 0 | 0 | — |
| 25 | Joe Prokop | NYJ | 39.4 | 16 | 0 | 0 | — |
| 26 | Bryan Wagner | CLE | 39.4 | 16 | 0 | 0 | — |
| 27 | Dale Hatcher | LAN | 38.8 | 16 | 0 | 0 | — |
| 28 |
 Jeff Feagles |
NE | 38.0 | 16 | 0 | 0 | — |