

1989 NFC Receiving Yards per Game Leaders
Receiving yards per game played
Henry Ellard led the NFC in receiving yards per game in 1989 with 98.7, 6.0 ahead of Jerry Rice (92.7).
Showing players who met 1.875 receptions per team game. Show all players
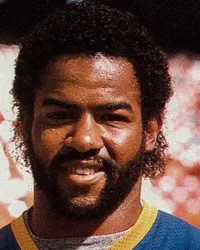 Led the NFC in 1989
Henry Ellard
LAN
98.7
Receiving Yards per Game
6.0 clear of Jerry Rice
Showing Receiving Yards per Game and the stats that give it context
Full stat line
| # | Player | Team | Y/G | G | REC | YDS | TD |
|---|---|---|---|---|---|---|---|
| 1 |
 Henry Ellard |
LAN | 98.7 | 14 | 70 | 1,382 | 8 |
| 2 |
 Jerry Rice |
SF | 92.7 | 16 | 82 | 1,483 | 17 |
| 3 |
 Sterling Sharpe |
GB | 88.9 | 16 | 90 | 1,423 | 12 |
| 4 | Mark Carrier | TB | 88.9 | 16 | 86 | 1,422 | 9 |
| 5 |
 J.T. Smith |
PHO | 86.4 | 9 | 62 | 778 | 5 |
| 6 |
 Gary Clark |
WAS | 81.9 | 15 | 79 | 1,229 | 9 |
| 7 |
 Art Monk |
WAS | 74.1 | 16 | 86 | 1,186 | 8 |
| 8 |
 John Taylor |
SF | 71.8 | 15 | 60 | 1,077 | 10 |
| 9 |
 Flipper Anderson |
LAN | 71.6 | 16 | 44 | 1,146 | 5 |
| 10 |
 Ricky Sanders |
WAS | 71.1 | 16 | 80 | 1,138 | 4 |
| 11 | Richard Johnson | DET | 68.2 | 16 | 70 | 1,091 | 8 |
| 12 |
 Eric Martin |
NO | 68.1 | 16 | 68 | 1,090 | 8 |
| 13 |
 Anthony Carter |
MIN | 66.6 | 16 | 65 | 1,066 | 4 |
| 14 |
 Roy Green |
PHO | 58.6 | 12 | 44 | 703 | 7 |
| 15 | Kelvin Martin | DAL | 58.5 | 11 | 46 | 644 | 2 |
| 16 | Ernie Jones | PHO | 55.9 | 15 | 45 | 838 | 3 |
| 17 | Shawn Collins | ATL | 53.9 | 16 | 58 | 862 | 3 |
| 18 |
 Michael Haynes |
ATL | 52.4 | 13 | 40 | 681 | 4 |
| 19 | Robert Clark | DET | 46.8 | 16 | 41 | 748 | 2 |
| 20 | Keith Jackson | PHI | 46.3 | 14 | 63 | 648 | 3 |
| 21 |
 Keith Byars |
PHI | 45.1 | 16 | 68 | 721 | 0 |
| 22 | Perry Kemp | GB | 43.6 | 14 | 48 | 611 | 2 |
| 23 | Hassan Jones | MIN | 43.4 | 16 | 42 | 694 | 1 |
| 24 | Bruce Hill | TB | 42.1 | 16 | 50 | 673 | 5 |
| 25 | Lonzell Hill | NO | 39.8 | 16 | 48 | 636 | 4 |
| 26 | Tom Rathman | SF | 38.5 | 16 | 73 | 616 | 1 |
| 27 |
 Cris Carter |
PHI | 37.8 | 16 | 45 | 605 | 11 |
| 28 | Odessa Turner | NYG | 35.9 | 13 | 38 | 467 | 4 |
| 29 | Lionel Manuel | NYG | 33.7 | 16 | 33 | 539 | 1 |
| 30 | Dave Meggett | NYG | 33.2 | 16 | 34 | 531 | 4 |
| 31 | Keith Woodside | GB | 32.9 | 16 | 59 | 527 | 0 |
| 32 |
 Dalton Hilliard |
NO | 32.1 | 16 | 52 | 514 | 5 |
| 33 | Pete Holohan | LAN | 31.9 | 16 | 51 | 510 | 2 |
| 34 | Steve Jordan | MIN | 31.6 | 16 | 35 | 506 | 3 |
| 35 | Brent Jones | SF | 31.3 | 16 | 40 | 500 | 4 |
| 36 | Ron Morris | CHI | 30.4 | 16 | 30 | 486 | 1 |
| 37 |
 Roger Craig |
SF | 29.6 | 16 | 49 | 473 | 1 |
| 38 | Gene Lang | ATL | 29.1 | 15 | 39 | 436 | 1 |
| 39 | Dennis Gentry | CHI | 28.9 | 16 | 39 | 463 | 1 |
| 40 |
 Earnest Byner |
WAS | 28.6 | 16 | 54 | 458 | 2 |
| 41 | Keith Jones | ATL | 28.3 | 14 | 41 | 396 | 0 |
| 42 | Neal Anderson | CHI | 27.1 | 16 | 50 | 434 | 4 |
| 43 |
 Herschel Walker |
MIN | 26.4 | 16 | 40 | 423 | 2 |
| 44 | Hoby Brenner | NO | 24.9 | 16 | 34 | 398 | 4 |
| 45 | Herman Fontenot | GB | 23.3 | 16 | 40 | 372 | 3 |
| 46 | Robert Awalt | PHO | 22.5 | 16 | 33 | 360 | 0 |
| 47 |
 James Wilder |
TB | 22.3 | 15 | 36 | 335 | 3 |
| 48 | Jason Phillips | DET | 22.0 | 16 | 30 | 352 | 1 |
| 49 | Ron Heller | ATL | 21.6 | 15 | 33 | 324 | 1 |
| 50 |
 John Settle |
ATL | 21.1 | 15 | 39 | 316 | 2 |
1–50 of 56Next →