

2002 NFC Interception Percentage Leaders
Interceptions per pass attempt
Brad Johnson led the NFC in interception percentage with 1.3% in 2002, 0.4 percentage points ahead of Donovan McNabb (1.7%).
Showing players who met 14 pass attempts per team game. Show all players
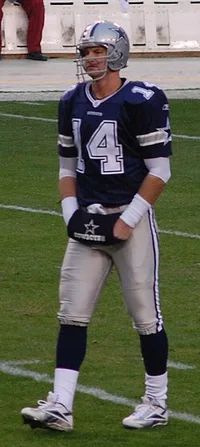 Led the NFC in 2002
Brad Johnson
Tampa Bay Buccaneers
1.3%
Interception Percentage
0.4% clear of Donovan McNabb
Showing Interception Percentage and the stats that give it context
Full stat line
| # | Player | Team | INT% | G | ATT | YDS | TD |
|---|---|---|---|---|---|---|---|
| 1 |
 Brad Johnson |
TB | 1.3% | 13 | 451 | 3,049 | 22 |
| 2 |
 Donovan McNabb |
PHI | 1.7% | 10 | 361 | 2,289 | 17 |
| 3 |
 Jeff Garcia |
SF | 1.9% | 16 | 528 | 3,344 | 21 |
| 4 |
 Mike Vick |
ATL | 1.9% | 15 | 421 | 2,936 | 16 |
| 5 |
 Matt Hasselbeck |
SEA | 2.4% | 13 | 419 | 3,075 | 15 |
| 6 | Shane Matthews | WAS | 2.5% | 7 | 237 | 1,251 | 11 |
| 7 |
 Kerry Collins |
NYG | 2.6% | 16 | 545 | 4,073 | 19 |
| 8 |
 Aaron Brooks |
NO | 2.8% | 16 | 528 | 3,572 | 27 |
| 9 | Jim Miller | CHI | 2.9% | 10 | 314 | 1,944 | 13 |
| 10 |
 Brett Favre |
GB | 2.9% | 16 | 551 | 3,658 | 27 |
| 11 | Chad Hutchinson | DAL | 3.2% | 9 | 250 | 1,555 | 7 |
| 12 |
 Patrick Ramsey |
WAS | 3.5% | 9 | 227 | 1,539 | 9 |
| 13 |
 Rodney Peete |
CAR | 3.7% | 14 | 381 | 2,630 | 15 |
| 14 |
 Joey Harrington |
DET | 3.7% | 14 | 429 | 2,294 | 12 |
| 15 |
 Jake Plummer |
ARI | 3.8% | 16 | 530 | 2,972 | 18 |
| 16 |
 Daunte Culpepper |
MIN | 4.2% | 16 | 549 | 3,853 | 18 |