

2010 NFC Yards per Carry Leaders
Rushing yards per attempt
Brandon Jacobs led the NFC in yards per carry in 2010 with 5.60, 0.37 ahead of Chris Ivory (5.23).
Showing players who met 6.25 carries per team game. Show all players
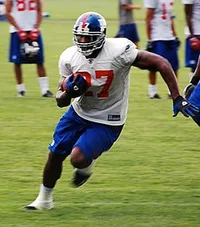 Led the NFC in 2010
Brandon Jacobs
New York Giants
5.60
Yards per Carry
0.37 clear of Chris Ivory
Showing Yards per Carry and the stats that give it context
Full stat line
| # | Player | Team | Y/A | G | ATT | YDS | TD |
|---|---|---|---|---|---|---|---|
| 1 |
 Brandon Jacobs |
NYG | 5.60 | 16 | 147 | 823 | 9 |
| 2 |
 Chris Ivory |
NO | 5.23 | 12 | 137 | 716 | 5 |
| 3 |
 LeSean McCoy |
PHI | 5.22 | 15 | 207 | 1,080 | 7 |
| 4 |
 LeGarrette Blount |
TB | 5.01 | 13 | 201 | 1,007 | 6 |
| 5 |
 Tim Hightower |
ARI | 4.81 | 16 | 153 | 736 | 5 |
| 6 |
 Adrian Peterson |
MIN | 4.59 | 15 | 283 | 1,298 | 12 |
| 7 | Ryan Torain | WAS | 4.52 | 10 | 164 | 742 | 4 |
| 8 |
 Matt Forte |
CHI | 4.51 | 16 | 237 | 1,069 | 6 |
| 9 |
 Ahmad Bradshaw |
NYG | 4.47 | 16 | 276 | 1,235 | 8 |
| 10 |
 Justin Forsett |
SEA | 4.43 | 16 | 118 | 523 | 2 |
| 11 |
 Mike Goodson |
CAR | 4.39 | 16 | 103 | 452 | 3 |
| 12 |
 Jonathan Stewart |
CAR | 4.33 | 14 | 178 | 770 | 2 |
| 13 |
 Felix Jones |
DAL | 4.32 | 16 | 185 | 800 | 1 |
| 14 |
 Frank Gore |
SF | 4.20 | 11 | 203 | 853 | 3 |
| 15 |
 Michael Turner |
ATL | 4.10 | 16 | 334 | 1,371 | 12 |
| 16 |
 Steven Jackson |
LA | 3.76 | 16 | 330 | 1,241 | 6 |
| 17 |
 Brandon Jackson |
GB | 3.70 | 16 | 190 | 703 | 3 |
| 18 |
 Marshawn Lynch |
SEA | 3.65 | 16 | 202 | 737 | 6 |
| 19 |
 Cadillac Williams |
TB | 3.50 | 16 | 125 | 437 | 2 |
| 20 |
 Chris Wells |
ARI | 3.42 | 13 | 116 | 397 | 2 |
| 21 |
 Marion Barber |
DAL | 3.31 | 13 | 113 | 374 | 4 |
| 22 |
 Jahvid Best |
DET | 3.27 | 15 | 172 | 563 | 4 |
| 23 |
 Chester Taylor |
CHI | 2.38 | 16 | 112 | 267 | 3 |