

2014 NFC Field Goal Percentage Leaders
Share of field goals made
Josh Brown led the NFC in field goal percentage in 2014 with 92.3%, 1.7 percentage points ahead of Matt Bryant (90.6%). It was one of 3 times Josh Brown led in field goal percentage.
Showing players who met 0.75 field goal attempts per team game, or 2.5 punts per team game on the punting boards. Show all players
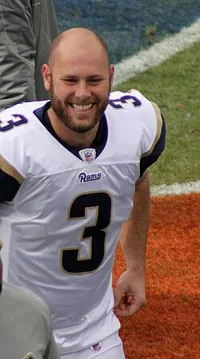 Led the NFC in 2014
Josh Brown
New York Giants
92.3%
Field Goal Percentage
1.7% clear of Matt Bryant
Showing Field Goal Percentage and the stats that give it context
Full stat line
| # | Player | Team | FG% | G | FGM | FGA |
|---|---|---|---|---|---|---|
| 1 |
 Josh Brown |
NYG | 92.3% | 16 | 24 | 26 |
| 2 |
 Matt Bryant |
ATL | 90.6% | 16 | 29 | 32 |
| 3 |
 Kai Forbath |
WAS | 88.9% | 16 | 24 | 27 |
| 4 |
 Cody Parkey |
PHI | 88.9% | 16 | 32 | 36 |
| 5 |
 Chandler Catanzaro |
ARI | 87.9% | 16 | 29 | 33 |
| 6 |
 Shayne Graham |
NO | 86.4% | 16 | 19 | 22 |
| 7 |
 Dan Bailey |
DAL | 86.2% | 16 | 25 | 29 |
| 8 |
 Steven Hauschka |
SEA | 83.8% | 16 | 31 | 37 |
| 9 |
 Patrick Murray |
TB | 83.3% | 16 | 20 | 24 |
| 10 |
 Graham Gano |
CAR | 82.9% | 16 | 29 | 35 |
| 11 |
 Mason Crosby |
GB | 81.8% | 16 | 27 | 33 |
| 12 |
 Matt Prater |
DET | 80.8% | 11 | 21 | 26 |
| 13 |
 Phil Dawson |
SF | 80.6% | 16 | 25 | 31 |
| 14 |
 Greg Zuerlein |
LA | 80.0% | 16 | 24 | 30 |
| 15 |
 Robbie Gould |
CHI | 75.0% | 12 | 9 | 12 |
| 16 |
 Blair Walsh |
MIN | 74.3% | 16 | 26 | 35 |