

2014 NFC Touchdown Percentage Leaders
Touchdowns per pass attempt
Tony Romo led the NFC in touchdown percentage in 2014 with 7.8%, 0.5 percentage points ahead of Aaron Rodgers (7.3%).
Showing players who met 14 pass attempts per team game. Show all players
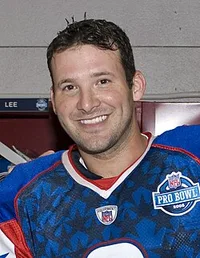 Led the NFC in 2014
Tony Romo
Dallas Cowboys
7.8%
Touchdown Percentage
0.5% clear of Aaron Rodgers
Showing Touchdown Percentage and the stats that give it context
Full stat line
| # | Player | Team | TD% | G | ATT | YDS | TD |
|---|---|---|---|---|---|---|---|
| 1 |
 Tony Romo |
DAL | 7.8% | 15 | 435 | 3,705 | 34 |
| 2 |
 Aaron Rodgers |
GB | 7.3% | 16 | 520 | 4,381 | 38 |
| 3 |
 Drew Brees |
NO | 5.0% | 16 | 659 | 4,952 | 33 |
| 4 |
 Eli Manning |
NYG | 5.0% | 16 | 601 | 4,410 | 30 |
| 5 |
 Jay Cutler |
CHI | 5.0% | 15 | 561 | 3,812 | 28 |
| 6 |
 Carson Palmer |
ARI | 4.9% | 6 | 224 | 1,626 | 11 |
| 7 |
 Mark Sanchez |
PHI | 4.5% | 9 | 309 | 2,418 | 14 |
| 8 |
 Matt Ryan |
ATL | 4.5% | 16 | 628 | 4,694 | 28 |
| 9 |
 Russell Wilson |
SEA | 4.4% | 16 | 452 | 3,475 | 20 |
| 10 |
 Austin Davis |
LA | 4.2% | 9 | 284 | 2,001 | 12 |
| 11 |
 Nick Foles |
PHI | 4.2% | 8 | 311 | 2,163 | 13 |
| 12 |
 Cam Newton |
CAR | 4.0% | 14 | 448 | 3,127 | 18 |
| 13 |
 Colin Kaepernick |
SF | 4.0% | 16 | 478 | 3,369 | 19 |
| 14 |
 Matthew Stafford |
DET | 3.7% | 16 | 602 | 4,257 | 22 |
| 15 |
 Shaun Hill |
LA | 3.5% | 8 | 229 | 1,657 | 8 |
| 16 |
 Teddy Bridgewater |
MIN | 3.5% | 13 | 402 | 2,919 | 14 |
| 17 |
 Josh McCown |
TB | 3.4% | 11 | 327 | 2,206 | 11 |
| 18 |
 Drew Stanton |
ARI | 2.9% | 9 | 240 | 1,711 | 7 |