

2023 NFL Yards per Attempt Leaders
Passing yards per attempt
Brock Purdy led the NFL in yards per attempt with 9.64 in 2023, 1.38 ahead of Tua Tagovailoa (8.26). It stands 7th among all single seasons in NFL history.
Showing players who met 14 pass attempts per team game. Show all players
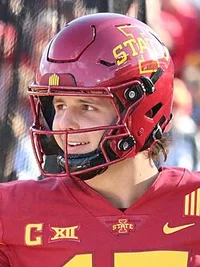 Led the whole NFL in 2023
Brock Purdy
San Francisco 49ers
9.64
Yards per Attempt
1.38 clear of Tua Tagovailoa
Showing Yards per Attempt and the stats that give it context
Full stat line
| # | Player | Team | Y/A | G | ATT | YDS | TD |
|---|---|---|---|---|---|---|---|
| 1 |
 Brock Purdy |
SF | 9.64 | 16 | 444 | 4,280 | 31 |
| 2 |
 Tua Tagovailoa |
MIA | 8.26 | 17 | 560 | 4,624 | 29 |
| 3 |
 C.J. Stroud |
HOU | 8.23 | 15 | 499 | 4,108 | 23 |
| 4 |
 Lamar Jackson |
BAL | 8.05 | 16 | 457 | 3,678 | 24 |
| 5 |
 Jake Browning |
CIN | 7.97 | 9 | 243 | 1,936 | 12 |
| 6 |
 Dak Prescott |
DAL | 7.65 | 17 | 590 | 4,516 | 36 |
| 7 |
 Matthew Stafford |
LA | 7.61 | 15 | 521 | 3,965 | 24 |
| 8 |
 Jared Goff |
DET | 7.56 | 17 | 605 | 4,575 | 30 |
| 9 |
 Kirk Cousins |
MIN | 7.50 | 8 | 311 | 2,331 | 18 |
| 10 |
 Josh Allen |
BUF | 7.44 | 17 | 579 | 4,306 | 29 |
| 11 |
 Desmond Ridder |
ATL | 7.31 | 15 | 388 | 2,836 | 12 |
| 12 |
 Geno Smith |
SEA | 7.26 | 15 | 499 | 3,624 | 20 |
| 13 |
 Jordan Love |
GB | 7.18 | 17 | 579 | 4,159 | 32 |
| 14 |
 Jalen Hurts |
PHI | 7.17 | 17 | 538 | 3,858 | 23 |
| 15 |
 Baker Mayfield |
TB | 7.14 | 17 | 566 | 4,044 | 28 |
| 16 |
 Trevor Lawrence |
JAX | 7.12 | 16 | 564 | 4,016 | 21 |
| 17 |
 Will Levis |
TEN | 7.09 | 9 | 255 | 1,808 | 8 |
| 18 |
 Derek Carr |
NO | 7.08 | 17 | 548 | 3,878 | 25 |
| 19 |
 Patrick Mahomes |
KC | 7.01 | 16 | 597 | 4,183 | 27 |
| 20 |
 Justin Fields |
CHI | 6.92 | 13 | 370 | 2,562 | 16 |
| 21 |
 Justin Herbert |
LAC | 6.87 | 13 | 456 | 3,134 | 20 |
| 22 |
 Russell Wilson |
DEN | 6.87 | 15 | 447 | 3,070 | 26 |
| 23 |
 Gardner Minshew |
IND | 6.74 | 16 | 490 | 3,305 | 15 |
| 24 |
 Kyler Murray |
ARI | 6.71 | 8 | 268 | 1,799 | 10 |
| 25 |
 Aidan O'Connell |
LV | 6.47 | 11 | 343 | 2,218 | 12 |
| 26 |
 Sam Howell |
WAS | 6.45 | 17 | 612 | 3,946 | 21 |
| 27 |
 Kenny Pickett |
PIT | 6.39 | 12 | 324 | 2,070 | 6 |
| 28 |
 Joe Burrow |
CIN | 6.33 | 10 | 365 | 2,309 | 15 |
| 29 |
 Zach Wilson |
NYJ | 6.17 | 12 | 368 | 2,271 | 8 |
| 30 |
 Mac Jones |
NE | 6.14 | 11 | 345 | 2,120 | 10 |
| 31 |
 Joshua Dobbs |
MIN | 5.91 | 13 | 417 | 2,464 | 13 |
| 32 |
 Bryce Young |
CAR | 5.46 | 16 | 527 | 2,877 | 11 |