

1972-1973 NHL Points per Game Leaders
Points per game played
Phil Esposito led the NHL in points per game with 1.67 in the 1972-1973 season, 0.07 ahead of Bobby Orr (1.60). It stands 80th among all single seasons in NHL history. It was one of 5 times Phil Esposito led in points per game.
Showing players who met half a season played. Show all players
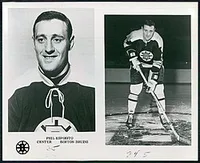 Led the NHL in 1972-1973
Phil Esposito
BOS
1.67
Points per Game
0.07 clear of Bobby Orr
Showing Points per Game and the stats that give it context
Full stat line
| # | Player | Team | P/GP | GP | G | A | P |
|---|---|---|---|---|---|---|---|
| 1 |
 Phil Esposito |
BOS | 1.67 | 78 | 55 | 75 | 130 |
| 2 |
 Bobby Orr |
BOS | 1.60 | 63 | 29 | 72 | 101 |
| 3 |
 Stan Mikita |
CHI | 1.46 | 57 | 27 | 56 | 83 |
| 4 |
 Bobby Clarke |
PHI | 1.33 | 78 | 37 | 67 | 104 |
| 5 |
 Rick MacLeish |
PHI | 1.28 | 78 | 50 | 50 | 100 |
| 6 | Jacques Lemaire | MTL | 1.23 | 77 | 44 | 51 | 95 |
| 7 |
 Mickey Redmond |
DET | 1.22 | 76 | 52 | 41 | 93 |
| 8 |
 Jim Pappin |
CHI | 1.21 | 76 | 41 | 51 | 92 |
| 9 |
 Jean Ratelle |
NYR | 1.21 | 78 | 41 | 53 | 94 |
| 10 |
 Johnny Bucyk |
BOS | 1.19 | 78 | 40 | 53 | 93 |
| 11 |
 Frank Mahovlich |
MTL | 1.19 | 78 | 38 | 55 | 93 |
| 12 |
 Yvan Cournoyer |
MTL | 1.18 | 67 | 40 | 39 | 79 |
| 13 |
 Marcel Dionne |
DET | 1.17 | 77 | 40 | 50 | 90 |
| 14 | Dennis Hull | CHI | 1.15 | 78 | 39 | 51 | 90 |
| 15 |
 Pit Martin |
CHI | 1.15 | 78 | 29 | 61 | 90 |
| 16 |
 Gilbert Perreault |
BUF | 1.13 | 78 | 28 | 60 | 88 |
| 17 |
 Ken Hodge |
BOS | 1.11 | 73 | 37 | 44 | 81 |
| 18 | Rene Robert | BUF | 1.11 | 75 | 40 | 43 | 83 |
| 19 |
 Rod Gilbert |
NYR | 1.11 | 76 | 25 | 59 | 84 |
| 20 |
 Syl Apps Jr. |
PIT | 1.10 | 77 | 29 | 56 | 85 |
| 21 |
 Bill Flett |
PHI | 1.07 | 69 | 43 | 31 | 74 |
| 22 | Dennis Hextall | MNS | 1.05 | 78 | 30 | 52 | 82 |
| 23 | Gary Dornhoefer | PHI | 1.03 | 77 | 30 | 49 | 79 |
| 24 |
 Garry Unger |
STL | 1.03 | 78 | 41 | 39 | 80 |
| 25 |
 Brad Park |
NYR | 1.02 | 52 | 10 | 43 | 53 |
| 26 | Fred Stanfield | BOS | 1.00 | 78 | 20 | 58 | 78 |
| 27 |
 Darryl Sittler |
TOR | 0.99 | 78 | 29 | 48 | 77 |
| 28 |
 Vic Hadfield |
NYR | 0.98 | 63 | 28 | 34 | 62 |
| 29 | Al McDonough | PIT | 0.97 | 78 | 35 | 41 | 76 |
| 30 | Rick Kehoe | TOR | 0.97 | 77 | 33 | 42 | 75 |
| 31 |
 Rick Martin |
BUF | 0.97 | 75 | 37 | 36 | 73 |
| 32 |
 Peter Mahovlich |
MTL | 0.97 | 61 | 21 | 38 | 59 |
| 33 |
 Lowell MacDonald |
PIT | 0.96 | 78 | 34 | 41 | 75 |
| 34 | J.P. Parise | MNS | 0.96 | 78 | 27 | 48 | 75 |
| 35 |
 Dave Keon |
TOR | 0.96 | 76 | 37 | 36 | 73 |
| 36 | Jude Drouin | MNS | 0.94 | 78 | 27 | 46 | 73 |
| 37 |
 Bill Barber |
PHI | 0.93 | 69 | 30 | 34 | 64 |
| 38 |
 Alex Delvecchio |
DET | 0.92 | 77 | 18 | 53 | 71 |
| 39 |
 Bobby Schmautz |
VAN | 0.92 | 77 | 38 | 33 | 71 |
| 40 | Andre Boudrias | VAN | 0.91 | 77 | 30 | 40 | 70 |
| 41 |
 Juha Widing |
LAK | 0.91 | 77 | 16 | 54 | 70 |
| 42 | Serge Bernier | LAK | 0.91 | 75 | 22 | 46 | 68 |
| 43 |
 Wayne Cashman |
BOS | 0.89 | 76 | 29 | 39 | 68 |
| 44 |
 Butch Goring |
LAK | 0.88 | 67 | 28 | 31 | 59 |
| 45 | Steve Vickers | NYR | 0.87 | 61 | 30 | 23 | 53 |
| 46 |
 Walt Tkaczuk |
NYR | 0.87 | 76 | 27 | 39 | 66 |
| 47 |
 Mike Corrigan |
LAK | 0.86 | 78 | 37 | 30 | 67 |
| 48 |
 Danny Grant |
MNS | 0.86 | 78 | 32 | 35 | 67 |
| 49 | Paul Henderson | TOR | 0.85 | 40 | 18 | 16 | 34 |
| 50 |
 Norm Ullman |
TOR | 0.85 | 65 | 20 | 35 | 55 |
1–50 of 278Next →