

1949 AL Strikeout-to-Walk Leaders
Strikeouts per walk
Mike Garcia led the AL in strikeout-to-walk in 1949 with 1.57, 0.13 ahead of Art Houtteman (1.44).
Showing pitchers with at least 154.0 innings — the standard 1.0 inning per team game. Show all players
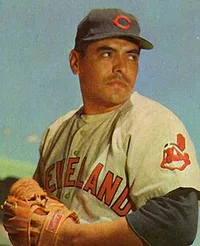 Led the AL in 1949
Mike Garcia
Cleveland Indians
1.57
Strikeout-to-Walk
0.13 clear of Art Houtteman
Showing Strikeout-to-Walk and the stats that give it context
Full stat line
| # | Player | Team | K/BB | W | L | ERA | IP |
|---|---|---|---|---|---|---|---|
| 1 |
 Mike Garcia |
CLE | 1.57 | 14 | 5 | 2.36 | 175.2 |
| 2 |
 Art Houtteman |
DET | 1.44 | 15 | 10 | 3.71 | 203.2 |
| 3 |
 Ellis Kinder |
BOS | 1.39 | 23 | 6 | 3.36 | 252.0 |
| 4 |
 Hal Newhouser |
DET | 1.30 | 18 | 11 | 3.36 | 292.0 |
| 5 |
 Bob Feller |
CLE | 1.29 | 15 | 14 | 3.75 | 211.0 |
| 6 |
 Virgil Trucks |
DET | 1.23 | 19 | 11 | 2.81 | 275.0 |
| 7 |
 Early Wynn |
CLE | 1.09 | 11 | 7 | 4.15 | 164.2 |
| 8 |
 Fred Hutchinson |
DET | 1.04 | 15 | 7 | 2.96 | 188.2 |
| 9 |
 Bob Lemon |
CLE | 1.01 | 22 | 10 | 2.99 | 279.2 |
| 10 |
 Eddie Lopat |
NYA | 1.01 | 15 | 10 | 3.26 | 215.1 |
| 11 |
 Lou Brissie |
PHA | 1.00 | 16 | 11 | 4.28 | 229.1 |
| 12 |
 Randy Gumpert |
CHA | 0.94 | 13 | 16 | 3.81 | 234.0 |
| 13 |
 Ted Gray |
DET | 0.93 | 10 | 10 | 3.51 | 195.0 |
| 14 |
 Ray Scarborough |
WS1 | 0.92 | 13 | 11 | 4.60 | 199.2 |
| 15 |
 Mel Parnell |
BOS | 0.91 | 25 | 7 | 2.77 | 295.1 |
| 16 |
 Mickey Harris |
WS1 +1 | 0.91 | 4 | 15 | 5.13 | 166.2 |
| 17 |
 Bob Kuzava |
CHA | 0.91 | 10 | 6 | 4.02 | 156.2 |
| 18 |
 Vic Raschi |
NYA | 0.90 | 21 | 10 | 3.34 | 274.2 |
| 19 |
 Joe Dobson |
BOS | 0.90 | 14 | 12 | 3.85 | 212.2 |
| 20 |
 Joe Coleman |
PHA | 0.86 | 13 | 14 | 3.86 | 240.1 |
| 21 |
 Allie Reynolds |
NYA | 0.85 | 17 | 6 | 4.00 | 213.2 |
| 22 |
 Billy Pierce |
CHA | 0.85 | 7 | 15 | 3.88 | 171.2 |
| 23 |
 Bill Wight |
CHA | 0.81 | 15 | 13 | 3.31 | 245.0 |
| 24 | Alex Kellner | PHA | 0.73 | 20 | 12 | 3.75 | 245.0 |
| 25 |
 Tommy Byrne |
NYA | 0.72 | 15 | 7 | 3.72 | 196.0 |
| 26 |
 Ned Garver |
SLA | 0.69 | 12 | 17 | 3.98 | 223.2 |
| 27 |
 Paul Calvert |
WS1 | 0.60 | 6 | 17 | 5.43 | 160.2 |
| 28 |
 Sid Hudson |
WS1 | 0.59 | 8 | 17 | 4.22 | 209.0 |
| 29 |
 Mickey Haefner |
WS1 +1 | 0.43 | 9 | 11 | 4.40 | 172.0 |
| 30 |
 Dick Fowler |
PHA | 0.37 | 15 | 11 | 3.75 | 213.2 |
| 31 |
 Carl Scheib |
PHA | 0.36 | 9 | 12 | 5.12 | 182.2 |