

1951 AL Pitcher Fielding Percentage Leaders
Share of chances handled cleanly at pitcher
Don Johnson led the AL in pitcher fielding percentage with 1.000 in 1951, 15 points ahead of Dizzy Trout (.985).
Showing pitchers with at least 154.0 innings — the same bar the ERA title asks for. Show all players
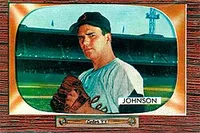 Led the AL in 1951
Don Johnson
Washington Senators
1.000
Pitcher Fielding Percentage
.015 clear of Dizzy Trout
Showing Pitcher Fielding Percentage and the stats that give it context
Full stat line
| # | Player | Team | P FPCT | G | PO | A | E |
|---|---|---|---|---|---|---|---|
| 1 |
 Don Johnson |
WS1 | 1.000 | 27 | 3 | 27 | 0 |
| 2 |
 Dizzy Trout |
DET | .985 | 42 | 18 | 47 | 1 |
| 3 |
 Early Wynn |
CLE | .982 | 37 | 13 | 42 | 1 |
| 4 |
 Ray Scarborough |
BOS | .980 | 37 | 18 | 30 | 1 |
| 5 |
 Duane Pillette |
SLA | .978 | 35 | 19 | 25 | 1 |
| 6 |
 Bob Lemon |
CLE | .976 | 42 | 21 | 60 | 2 |
| 7 |
 Bob Cain |
DET | .975 | 39 | 9 | 30 | 1 |
| 8 |
 Mike Garcia |
CLE | .970 | 47 | 18 | 46 | 2 |
| 9 |
 Bobby Shantz |
PHA | .970 | 32 | 20 | 44 | 2 |
| 10 |
 Chuck Stobbs |
BOS | .967 | 34 | 9 | 20 | 1 |
| 11 |
 Billy Pierce |
CHA | .961 | 37 | 11 | 38 | 2 |
| 12 | Alex Kellner | PHA | .958 | 33 | 15 | 31 | 2 |
| 13 |
 Ned Garver |
SLA | .958 | 33 | 26 | 42 | 3 |
| 14 |
 Eddie Lopat |
NYA | .952 | 31 | 9 | 50 | 3 |
| 15 |
 Vic Raschi |
NYA | .950 | 35 | 8 | 30 | 2 |
| 16 |
 Mickey McDermott |
BOS | .950 | 34 | 4 | 34 | 2 |
| 17 |
 Bob Feller |
CLE | .950 | 33 | 6 | 32 | 2 |
| 18 |
 Bob Hooper |
PHA | .948 | 38 | 18 | 37 | 3 |
| 19 |
 Saul Rogovin |
CHA | .944 | 27 | 16 | 35 | 3 |
| 20 |
 Mel Parnell |
BOS | .943 | 36 | 8 | 42 | 3 |
| 21 | Ken Holcombe | CHA | .943 | 28 | 8 | 42 | 3 |
| 22 |
 Fred Hutchinson |
DET | .939 | 31 | 17 | 45 | 4 |
| 23 |
 Ted Gray |
DET | .921 | 34 | 10 | 25 | 3 |
| 24 |
 Connie Marrero |
WS1 | .919 | 25 | 5 | 29 | 3 |
| 25 |
 Allie Reynolds |
NYA | .878 | 40 | 17 | 19 | 5 |