

2006 MLB Postseason On-Base Percentage Leaders
How often a batter reaches base
Sean Casey led the 2006 postseason in on-base percentage with .462, 20 points ahead of Carlos Delgado (.442).
Showing players with at least 20 plate appearances — 20 plate appearances in the postseason. Show all players
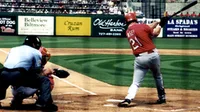 Led the postseason in 2006
Sean Casey
Detroit Tigers
.462
On-Base Percentage
.020 clear of Carlos Delgado
Showing On-Base Percentage and the stats that give it context
Full stat line
| # | Player | Team | OBP | G | AB | R | H |
|---|---|---|---|---|---|---|---|
| 1 |
 Sean Casey |
DET | .462 | 10 | 37 | 3 | 16 |
| 2 |
 Carlos Delgado |
NYN | .442 | 10 | 37 | 8 | 13 |
| 3 |
 Albert Pujols |
SLN | .439 | 16 | 52 | 11 | 15 |
| 4 |
 Carlos Guillen |
DET | .434 | 13 | 47 | 6 | 17 |
| 5 |
 Yadier Molina |
SLN | .424 | 16 | 53 | 5 | 19 |
| 6 |
 Carlos Beltran |
NYN | .422 | 10 | 36 | 10 | 10 |
| 7 |
 Nick Swisher |
OAK | .407 | 7 | 20 | 3 | 4 |
| 8 |
 Shawn Green |
NYN | .405 | 9 | 32 | 3 | 10 |
| 9 |
 Jim Edmonds |
SLN | .381 | 16 | 52 | 8 | 13 |
| 10 |
 Placido Polanco |
DET | .375 | 13 | 51 | 5 | 16 |
| 11 |
 Frank Thomas |
OAK | .357 | 7 | 23 | 3 | 5 |
| 12 |
 Scott Rolen |
SLN | .351 | 15 | 51 | 9 | 14 |
| 13 |
 David Eckstein |
SLN | .338 | 16 | 63 | 7 | 16 |
| 14 |
 Paul Lo Duca |
NYN | .333 | 10 | 40 | 5 | 11 |
| 15 |
 Eric Chavez |
OAK | .333 | 7 | 23 | 3 | 5 |
| 16 |
 Jay Payton |
OAK | .333 | 7 | 26 | 4 | 8 |
| 17 |
 Brandon Inge |
DET | .327 | 13 | 44 | 4 | 12 |
| 18 |
 Milton Bradley |
OAK | .323 | 7 | 31 | 5 | 10 |
| 19 |
 David Wright |
NYN | .310 | 10 | 37 | 3 | 8 |
| 20 |
 Jose Valentin |
NYN | .308 | 10 | 33 | 2 | 6 |
| 21 |
 Jason Kendall |
OAK | .303 | 7 | 31 | 1 | 8 |
| 22 |
 Preston Wilson |
SLN | .300 | 13 | 35 | 5 | 7 |
| 23 |
 Jose Reyes |
NYN | .298 | 10 | 44 | 7 | 11 |
| 24 |
 Ronnie Belliard |
SLN | .296 | 14 | 50 | 2 | 12 |
| 25 |
 Craig Monroe |
DET | .291 | 13 | 50 | 11 | 12 |
| 26 |
 Curtis Granderson |
DET | .288 | 13 | 53 | 8 | 12 |
| 27 |
 Scott Spiezio |
SLN | .276 | 10 | 26 | 4 | 5 |
| 28 |
 Marcus Thames |
DET | .273 | 8 | 21 | 3 | 5 |
| 29 |
 Chris Duncan |
SLN | .269 | 10 | 22 | 3 | 3 |
| 30 |
 Juan Encarnacion |
SLN | .260 | 13 | 44 | 2 | 8 |
| 31 |
 Magglio Ordonez |
DET | .255 | 13 | 51 | 8 | 10 |
| 32 |
 Mark Kotsay |
OAK | .250 | 7 | 30 | 5 | 6 |
| 33 |
 Endy Chavez |
NYN | .229 | 10 | 35 | 2 | 8 |
| 34 |
 Ivan Rodriguez |
DET | .212 | 13 | 48 | 6 | 8 |
| 35 |
 Marco Scutaro |
OAK | .185 | 7 | 27 | 1 | 5 |