

2008 MLB Postseason Earned Run Average Leaders
Earned runs allowed per nine innings
Jonathan Papelbon led the 2008 postseason in earned run average with 0.00, 1.46 ahead of Hiroki Kuroda (1.46). It is the best single-season earned run average mark in MLB Postseason history. It was one of 2 times Jonathan Papelbon led in earned run average.
Showing pitchers with at least 10.0 innings — 10 innings in the postseason. Show all players
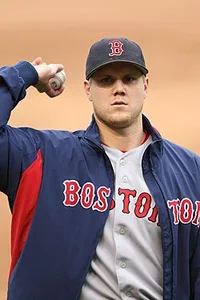 Led the postseason in 2008
Jonathan Papelbon
Boston Red Sox
0.00
Earned Run Average
1.46 clear of Hiroki Kuroda
Showing Earned Run Average and the stats that give it context
Full stat line
| # | Player | Team | ERA | W | L | G |
|---|---|---|---|---|---|---|
| 1 |
 Jonathan Papelbon |
BOS | 0.00 | 1 | 0 | 7 |
| 2 |
 Hiroki Kuroda |
LAN | 1.46 | 2 | 0 | 2 |
| 3 |
 Hideki Okajima |
BOS | 1.80 | 0 | 0 | 8 |
| 4 |
 Cole Hamels |
PHI | 1.80 | 4 | 0 | 5 |
| 5 |
 Ryan Madson |
PHI | 2.13 | 1 | 0 | 11 |
| 6 |
 Jon Lester |
BOS | 2.36 | 1 | 2 | 4 |
| 7 |
 John Lackey |
LAA | 2.63 | 0 | 1 | 2 |
| 8 |
 James Shields |
TBA | 2.88 | 2 | 2 | 4 |
| 9 |
 J. P. Howell |
TBA | 3.00 | 0 | 3 | 12 |
| 10 |
 Joe Blanton |
PHI | 3.18 | 2 | 0 | 3 |
| 11 |
 Derek Lowe |
LAN | 3.31 | 1 | 1 | 3 |
| 12 |
 Matt Garza |
TBA | 3.96 | 2 | 1 | 4 |
| 13 |
 Scott Kazmir |
TBA | 4.21 | 1 | 1 | 5 |
| 14 |
 Andy Sonnanstine |
TBA | 4.24 | 2 | 1 | 3 |
| 15 |
 Daisuke Matsuzaka |
BOS | 4.50 | 1 | 0 | 3 |
| 16 |
 Brett Myers |
PHI | 4.74 | 2 | 1 | 3 |
| 17 |
 Chad Billingsley |
LAN | 8.49 | 1 | 2 | 3 |
| 18 |
 Jamie Moyer |
PHI | 8.49 | 0 | 2 | 3 |
| 19 |
 Josh Beckett |
BOS | 8.79 | 1 | 0 | 3 |