

2003 MLB Postseason Earned Run Average Leaders
Earned runs allowed per nine innings
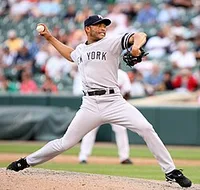
Mariano Rivera led the 2003 postseason in earned run average with 0.56, 0.84 ahead of Carl Pavano (1.40). It stands 68th among all single seasons in MLB Postseason history. It was one of 6 times Mariano Rivera led in earned run average.
Showing pitchers with at least 10.0 innings — 10 innings in the postseason. Show all players
 Led the postseason in 2003
Mariano Rivera
New York Yankees
0.56
Earned Run Average
0.84 clear of Carl Pavano
Showing Earned Run Average and the stats that give it context
Full stat line
| # | Player | Team | ERA | W | L | G |
|---|---|---|---|---|---|---|
| 1 |
 Mariano Rivera |
NYA | 0.56 | 1 | 0 | 8 |
| 2 |
 Carl Pavano |
FLO | 1.40 | 2 | 0 | 8 |
| 3 |
 Andy Pettitte |
NYA | 2.10 | 3 | 1 | 5 |
| 4 |
 Josh Beckett |
FLO | 2.11 | 2 | 2 | 6 |
| 5 |
 David Wells |
NYA | 2.31 | 2 | 1 | 5 |
| 6 |
 Mark Prior |
CHN | 2.31 | 2 | 1 | 3 |
| 7 |
 Tim Wakefield |
BOS | 2.91 | 2 | 2 | 5 |
| 8 |
 Mike Mussina |
NYA | 3.38 | 1 | 3 | 5 |
| 9 | Ugueth Urbina | FLO | 3.46 | 1 | 0 | 10 |
| 10 |
 Barry Zito |
OAK | 3.46 | 1 | 1 | 2 |
| 11 |
 Roger Clemens |
NYA | 3.52 | 2 | 0 | 4 |
| 12 | Chad Fox | FLO | 3.97 | 1 | 0 | 9 |
| 13 |
 Derek Lowe |
BOS | 4.18 | 0 | 3 | 5 |
| 14 |
 Kerry Wood |
CHN | 4.23 | 2 | 1 | 4 |
| 15 |
 Mike Hampton |
ATL | 4.26 | 0 | 1 | 2 |
| 16 |
 Pedro Martinez |
BOS | 4.76 | 1 | 1 | 4 |
| 17 |
 Russ Ortiz |
ATL | 5.06 | 1 | 1 | 2 |
| 18 |
 Matt Clement |
CHN | 5.11 | 1 | 1 | 2 |
| 19 |
 Carlos Zambrano |
CHN | 5.40 | 0 | 1 | 3 |
| 20 |
 Jose Contreras |
NYA | 5.73 | 0 | 2 | 8 |
| 21 |
 Brad Penny |
FLO | 5.73 | 3 | 1 | 7 |
| 22 | Mark Redman | FLO | 6.50 | 0 | 1 | 4 |
| 23 |
 Dontrelle Willis |
FLO | 8.53 | 0 | 1 | 7 |