

2000 MLB Postseason Earned Run Average Leaders
Earned runs allowed per nine innings
Mariano Rivera led the 2000 postseason in earned run average with 1.72, 1.12 ahead of Andy Pettitte (2.84). It was one of 6 times Mariano Rivera led in earned run average.
Showing pitchers with at least 10.0 innings — 10 innings in the postseason. Show all players
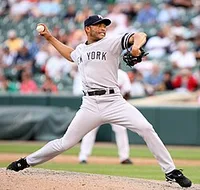 Led the postseason in 2000
Mariano Rivera
New York Yankees
1.72
Earned Run Average
1.12 clear of Andy Pettitte
Showing Earned Run Average and the stats that give it context
Full stat line
| # | Player | Team | ERA | W | L | G |
|---|---|---|---|---|---|---|
| 1 |
 Mariano Rivera |
NYA | 1.72 | 0 | 0 | 10 |
| 2 |
 Andy Pettitte |
NYA | 2.84 | 2 | 0 | 5 |
| 3 |
 Al Leiter |
NYN | 2.93 | 0 | 1 | 4 |
| 4 |
 Mike Hampton |
NYN | 2.96 | 2 | 2 | 4 |
| 5 |
 Roger Clemens |
NYA | 3.21 | 2 | 2 | 4 |
| 6 |
 Paul Abbott |
SEA | 3.38 | 1 | 1 | 2 |
| 7 |
 Aaron Sele |
SEA | 3.38 | 0 | 1 | 2 |
| 8 |
 Kevin Appier |
OAK | 3.48 | 0 | 1 | 2 |
| 9 |
 Freddy Garcia |
SEA | 3.60 | 2 | 0 | 3 |
| 10 |
 Orlando Hernandez |
NYA | 3.94 | 3 | 1 | 5 |
| 11 |
 Denny Neagle |
NYA | 4.30 | 0 | 2 | 3 |
| 12 |
 Bobby Jones |
NYN | 4.50 | 1 | 1 | 3 |
| 13 |
 Rick Reed |
NYN | 4.70 | 0 | 1 | 3 |
| 14 |
 Darryl Kile |
SLN | 6.35 | 1 | 2 | 3 |