

2021 MLB Postseason Earned Run Average Leaders
Earned runs allowed per nine innings
Will Smith led the 2021 postseason in earned run average with 0.00, 0.61 ahead of Logan Webb (0.61). It is the best single-season earned run average mark in MLB Postseason history.
Showing pitchers with at least 10.0 innings — 10 innings in the postseason. Show all players
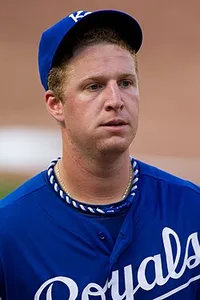 Led the postseason in 2021
Will Smith
Atlanta Braves
0.00
Earned Run Average
0.61 clear of Logan Webb
Showing Earned Run Average and the stats that give it context
Full stat line
| # | Player | Team | ERA | W | L | G |
|---|---|---|---|---|---|---|
| 1 |
 Will Smith |
ATL | 0.00 | 2 | 0 | 11 |
| 2 |
 Logan Webb |
SFN | 0.61 | 1 | 0 | 2 |
| 3 |
 Phil Maton |
HOU | 0.73 | 0 | 0 | 12 |
| 4 |
 Lance McCullers |
HOU | 0.84 | 1 | 0 | 2 |
| 5 |
 Ian Anderson |
ATL | 1.59 | 2 | 0 | 4 |
| 6 |
 Kendall Graveman |
HOU | 1.64 | 1 | 0 | 9 |
| 7 |
 Tyler Matzek |
ATL | 1.72 | 3 | 0 | 13 |
| 8 |
 Max Scherzer |
LAN | 2.16 | 0 | 1 | 4 |
| 9 |
 Ryne Stanek |
HOU | 2.45 | 2 | 0 | 13 |
| 10 |
 Nick Pivetta |
BOS | 2.63 | 1 | 0 | 3 |
| 11 |
 A. J. Minter |
ATL | 3.00 | 1 | 1 | 8 |
| 12 |
 Charlie Morton |
ATL | 3.24 | 0 | 1 | 4 |
| 13 |
 Cristian Javier |
HOU | 3.38 | 0 | 1 | 6 |
| 14 |
 Max Fried |
ATL | 4.23 | 2 | 2 | 5 |
| 15 |
 Nathan Eovaldi |
BOS | 4.79 | 2 | 2 | 5 |
| 16 |
 Walker Buehler |
LAN | 4.91 | 0 | 2 | 4 |
| 17 |
 Eduardo Rodriguez |
BOS | 4.97 | 1 | 1 | 3 |
| 18 |
 Tanner Houck |
BOS | 5.23 | 1 | 0 | 5 |
| 19 |
 Julio Urias |
LAN | 5.40 | 1 | 1 | 4 |
| 20 |
 Framber Valdez |
HOU | 7.78 | 1 | 1 | 5 |
| 21 |
 Luis Garcia |
HOU | 8.04 | 1 | 3 | 5 |