
2026 MLB Postseason Earned Run Average Leaders
Earned runs allowed per nine innings
Aaron Ashby and Bryan Baker shared the lead in the 2026 postseason in earned run average with 0.00, 0.60 ahead of Robert Gasser (0.60). It is the best single-season earned run average mark in MLB Postseason history.
Showing pitchers with at least 10.0 innings — 10 innings in the postseason. Show all players
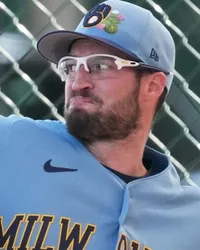 Led the postseason in 2026
Aaron Ashby
Milwaukee Brewers
0.00
Earned Run Average
Tied with Bryan Baker
Showing Earned Run Average and the stats that give it context
Full stat line
| # | Player | Team | ERA | W | L | G |
|---|---|---|---|---|---|---|
| 1 |
 Aaron Ashby |
MIL | 0.00 | 1 | 0 | 9 |
| 2 |
 Bryan Baker |
TBA | 0.00 | 0 | 0 | 9 |
| 3 |
 Robert Gasser |
MIL | 0.60 | 1 | 0 | 3 |
| 4 |
 Mike King |
SDN | 0.64 | 1 | 0 | 3 |
| 5 |
 Tyler Mahle |
ATL | 1.35 | 0 | 1 | 2 |
| 6 |
 Abner Uribe |
MIL | 1.54 | 1 | 0 | 11 |
| 7 | Cam Schlittler | NYA | 1.69 | 1 | 1 | 2 |
| 8 |
 Jacob Misiorowski |
MIL | 1.89 | 2 | 0 | 4 |
| 9 |
 Gavin Williams |
CLE | 2.16 | 2 | 0 | 4 |
| 10 |
 Drew Rasmussen |
TBA | 2.20 | 2 | 1 | 5 |
| 11 | Cade Smith | CLE | 2.38 | 0 | 0 | 9 |
| 12 |
 Tarik Skubal |
LAN | 2.45 | 1 | 1 | 2 |
| 13 |
 Nick Martinez |
TBA | 2.81 | 1 | 1 | 4 |
| 14 |
 Freddy Peralta |
TBA | 2.95 | 2 | 1 | 5 |
| 15 |
 Foster Griffin |
CLE | 3.48 | 1 | 0 | 3 |
| 16 |
 Sean Burke |
CHA | 3.77 | 1 | 1 | 3 |
| 17 |
 Max Fried |
NYA | 3.86 | 1 | 1 | 2 |
| 18 |
 Parker Messick |
CLE | 3.95 | 0 | 3 | 4 |
| 19 |
 Chris Sale |
ATL | 4.26 | 0 | 1 | 3 |
| 20 |
 Ian Seymour |
TBA | 4.50 | 2 | 0 | 9 |
| 21 |
 Logan Henderson |
MIL | 4.50 | 0 | 0 | 3 |
| 22 |
 Griffin Jax |
TBA | 5.40 | 0 | 1 | 3 |
| 23 |
 Dustin May |
MIL | 5.73 | 0 | 0 | 5 |