

1998-1999 NBA Points per Game Leaders
Points scored per game
Allen Iverson led the NBA in points per game with 26.8 in the 1998-1999 season, 0.5 ahead of Shaquille O'Neal (26.3). It was one of 4 times Allen Iverson led in points per game.
Showing players who met the games-played minimum for the season. Show all players
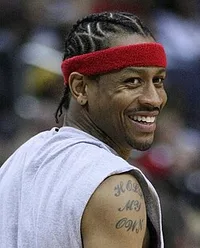 Led the NBA in 1998-1999
Allen Iverson
PHI
26.8
Points per Game
0.5 clear of Shaquille O'Neal
Showing Points per Game and the stats that give it context
Full stat line
| # | Player | Team | PPG | GP | MPG | PTS |
|---|---|---|---|---|---|---|
| 1 |
 Allen Iverson |
PHI | 26.8 | 48 | 41.5 | 1,284 |
| 2 |
 Shaquille O'Neal |
LAL | 26.3 | 49 | 34.8 | 1,289 |
| 3 |
 Karl Malone |
UTA | 23.8 | 49 | 37.4 | 1,164 |
| 4 |
 Shareef Abdur-Rahim |
VAN | 23.0 | 50 | 40.4 | 1,152 |
| 5 |
 Keith Van Horn |
NJN | 21.8 | 42 | 37.5 | 916 |
| 6 |
 Tim Duncan |
SAS | 21.7 | 50 | 39.3 | 1,084 |
| 7 |
 Gary Payton |
SEA | 21.7 | 50 | 40.2 | 1,084 |
| 8 |
 Stephon Marbury |
NJN | 21.3 | 49 | 38.7 | 1,044 |
| 9 |
 Antonio McDyess |
DEN | 21.2 | 50 | 38.7 | 1,061 |
| 10 |
 Grant Hill |
DET | 21.1 | 50 | 37.0 | 1,053 |
| 11 |
 Kevin Garnett |
MIN | 20.8 | 47 | 37.9 | 977 |
| 12 |
 Shawn Kemp |
CLE | 20.5 | 42 | 35.1 | 862 |
| 13 |
 Michael Finley |
DAL | 20.2 | 50 | 41.0 | 1,009 |
| 14 |
 Alonzo Mourning |
MIA | 20.1 | 46 | 38.1 | 924 |
| 15 |
 Chris Webber |
SAC | 20.0 | 42 | 40.9 | 839 |
| 16 |
 Kobe Bryant |
LAL | 19.9 | 50 | 37.9 | 996 |
| 17 |
 Mitch Richmond |
WAS | 19.7 | 50 | 38.2 | 983 |
| 18 |
 Juwan Howard |
WAS | 18.9 | 36 | 39.7 | 682 |
| 19 |
 Hakeem Olajuwon |
HOU | 18.9 | 50 | 35.7 | 945 |
| 20 |
 Toni Kukoc |
CHI | 18.8 | 44 | 37.6 | 828 |
| 21 |
 Antoine Walker |
BOS | 18.7 | 42 | 36.9 | 784 |
| 22 |
 Steven Smith |
ATL | 18.7 | 36 | 36.5 | 672 |
| 23 |
 Glenn Robinson |
MIL | 18.4 | 47 | 33.6 | 865 |
| 24 |
 Reggie Miller |
IND | 18.4 | 50 | 35.7 | 920 |
| 25 |
 Vince Carter |
TOR | 18.3 | 50 | 35.2 | 913 |
| 26 |
 Tim Hardaway |
MIA | 17.4 | 48 | 36.9 | 835 |
| 27 |
 Patrick Ewing |
NYK | 17.3 | 38 | 34.2 | 657 |
| 28 |
 Ray Allen |
MIL | 17.1 | 50 | 34.4 | 856 |
| 29 | Ron Mercer | BOS | 17.0 | 41 | 37.8 | 698 |
| 30 |
 Tom Gugliotta |
PHX | 17.0 | 43 | 36.3 | 729 |
| 31 |
 Jason Kidd |
PHX | 16.9 | 50 | 41.2 | 846 |
| 32 |
 Maurice Taylor |
LAC | 16.8 | 46 | 32.7 | 773 |
| 33 |
 Nick Van Exel |
DEN | 16.5 | 50 | 36.0 | 826 |
| 34 |
 Paul Pierce |
BOS | 16.5 | 48 | 34.0 | 791 |
| 35 | Clifford Robinson | PHX | 16.4 | 50 | 34.8 | 819 |
| 36 | Latrell Sprewell | NYK | 16.4 | 37 | 33.3 | 606 |
| 37 |
 Allan Houston |
NYK | 16.3 | 50 | 36.3 | 813 |
| 38 |
 Charles Barkley |
HOU | 16.1 | 42 | 36.3 | 676 |
| 39 | Gary Trent | DAL | 16.0 | 45 | 30.3 | 719 |
| 40 |
 Anfernee Hardaway |
ORL | 15.8 | 50 | 38.9 | 791 |
| 41 |
 David Robinson |
SAS | 15.8 | 49 | 31.7 | 775 |
| 42 |
 Rod Strickland |
WAS | 15.7 | 44 | 37.1 | 690 |
| 43 |
 Eddie Jones |
CHH | 15.6 | 50 | 37.6 | 780 |
| 44 |
 Doug Christie |
TOR | 15.2 | 50 | 35.4 | 760 |
| 45 |
 Detlef Schrempf |
SEA | 15.0 | 50 | 35.3 | 752 |
| 46 |
 Nick Anderson |
ORL | 14.9 | 47 | 33.6 | 701 |
| 47 | Rik Smits | IND | 14.9 | 49 | 25.9 | 728 |
| 48 |
 Scottie Pippen |
HOU | 14.5 | 50 | 40.2 | 726 |
| 49 |
 Jerry Stackhouse |
DET | 14.5 | 42 | 28.3 | 607 |
| 50 |
 Vlade Divac |
SAC | 14.3 | 50 | 35.2 | 714 |
1–50 of 257Next →