

1988 NFC Interception Percentage Leaders
Interceptions per pass attempt
Phil Simms led the NFC in interception percentage in 1988 with 2.3%, 0.2 percentage points ahead of Neil Lomax (2.5%).
Showing players who met 14 pass attempts per team game. Show all players
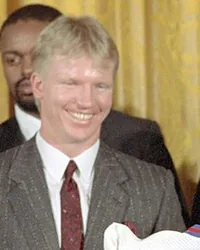 Led the NFC in 1988
Phil Simms
NYG
2.3%
Interception Percentage
0.2% clear of Neil Lomax
Showing Interception Percentage and the stats that give it context
Full stat line
| # | Player | Team | INT% | G | ATT | YDS | TD |
|---|---|---|---|---|---|---|---|
| 1 |
 Phil Simms |
NYG | 2.3% | 15 | 479 | 3,359 | 21 |
| 2 |
 Neil Lomax |
PHO | 2.5% | 14 | 443 | 3,395 | 20 |
| 3 |
 Joe Montana |
SF | 2.5% | 14 | 397 | 2,981 | 18 |
| 4 |
 Wade Wilson |
MIN | 2.7% | 14 | 332 | 2,746 | 15 |
| 5 |
 Randall Cunningham |
PHI | 2.9% | 16 | 560 | 3,808 | 24 |
| 6 |
 Bobby Hebert |
NO | 3.1% | 16 | 478 | 3,156 | 20 |
| 7 |
 Doug Williams |
WAS | 3.2% | 11 | 380 | 2,609 | 15 |
| 8 | Don Majkowski | GB | 3.3% | 13 | 336 | 2,119 | 9 |
| 9 |
 Chris Miller |
ATL | 3.4% | 13 | 351 | 2,133 | 11 |
| 10 |
 Jim Everett |
LAN | 3.5% | 16 | 517 | 3,964 | 31 |
| 11 | Rusty Hilger | DET | 3.9% | 11 | 306 | 1,558 | 7 |
| 12 | Steve Pelluer | DAL | 4.4% | 16 | 435 | 3,139 | 17 |
| 13 |
 Randy Wright |
GB | 5.3% | 8 | 244 | 1,490 | 4 |
| 14 |
 Vinny Testaverde |
TB | 7.5% | 15 | 466 | 3,240 | 13 |