

1988-1989 NBA Points per Game Leaders
Points scored per game
Michael Jordan led the NBA in points per game with 32.5 in the 1988-1989 season, 3.4 ahead of Karl Malone (29.1). It stands 28th among all single seasons in NBA history. It was one of 10 times Michael Jordan led in points per game.
Showing players who met the games-played minimum for the season. Show all players
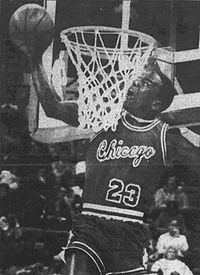 Led the NBA in 1988-1989
Michael Jordan
CHI
32.5
Points per Game
3.4 clear of Karl Malone
Showing Points per Game and the stats that give it context
Full stat line
| # | Player | Team | PPG | GP | MPG | PTS |
|---|---|---|---|---|---|---|
| 1 |
 Michael Jordan |
CHI | 32.5 | 81 | 40.2 | 2,633 |
| 2 |
 Karl Malone |
UTH | 29.1 | 80 | 39.1 | 2,326 |
| 3 |
 Dale Ellis |
SEA | 27.5 | 82 | 38.9 | 2,253 |
| 4 |
 Clyde Drexler |
POR | 27.2 | 78 | 39.3 | 2,123 |
| 5 |
 Chris Mullin |
GOS | 26.5 | 82 | 37.7 | 2,176 |
| 6 |
 Alex English |
DEN | 26.5 | 82 | 36.5 | 2,175 |
| 7 |
 Dominique Wilkins |
ATL | 26.2 | 80 | 37.5 | 2,099 |
| 8 |
 Charles Barkley |
PHL | 25.8 | 79 | 39.1 | 2,037 |
| 9 | Tom Chambers | PHX | 25.7 | 81 | 37.1 | 2,085 |
| 10 |
 Hakeem Olajuwon |
HOU | 24.8 | 82 | 36.9 | 2,034 |
| 11 |
 Terry Cummings |
MIL | 22.9 | 80 | 35.3 | 1,829 |
| 12 |
 Patrick Ewing |
NYK | 22.7 | 80 | 36.2 | 1,815 |
| 13 | Kelly Tripucka | CHH | 22.6 | 71 | 32.4 | 1,606 |
| 14 |
 Kevin McHale |
BOS | 22.5 | 78 | 36.9 | 1,758 |
| 15 |
 Magic Johnson |
LAL | 22.5 | 77 | 37.5 | 1,730 |
| 16 |
 Mitch Richmond |
GOS | 22.0 | 79 | 34.4 | 1,741 |
| 17 |
 Jeff Malone |
WAS | 21.7 | 76 | 31.8 | 1,651 |
| 18 | Chuck Person | IND | 21.6 | 80 | 37.7 | 1,728 |
| 19 |
 Eddie Johnson |
PHX | 21.5 | 70 | 29.2 | 1,504 |
| 20 |
 Bernard King |
WAS | 20.7 | 81 | 31.6 | 1,674 |
| 21 |
 James Worthy |
LAL | 20.5 | 81 | 36.5 | 1,657 |
| 22 | Xavier McDaniel | SEA | 20.5 | 82 | 29.1 | 1,677 |
| 23 |
 Kevin Johnson |
PHX | 20.4 | 81 | 39.2 | 1,650 |
| 24 |
 Moses Malone |
ATL | 20.2 | 81 | 35.5 | 1,637 |
| 25 |
 Lafayette Lever |
DEN | 19.8 | 71 | 38.7 | 1,409 |
| 26 | Rolando Blackman | DAL | 19.7 | 78 | 37.8 | 1,534 |
| 27 |
 Byron Scott |
LAL | 19.6 | 74 | 35.2 | 1,448 |
| 28 |
 Thurl Bailey |
UTH | 19.5 | 82 | 33.9 | 1,595 |
| 29 |
 Adrian Dantley |
DAL | 19.2 | 73 | 33.2 | 1,400 |
| 30 | Brad Daugherty | CLE | 18.9 | 78 | 36.2 | 1,475 |
| 31 |
 Mark Aguirre |
DET | 18.9 | 80 | 32.5 | 1,511 |
| 32 |
 Mark Price |
CLE | 18.9 | 75 | 36.4 | 1,414 |
| 33 | Willie Anderson | SAN | 18.6 | 81 | 33.8 | 1,508 |
| 34 |
 Ron Harper |
CLE | 18.6 | 82 | 34.8 | 1,526 |
| 35 |
 Robert Parish |
BOS | 18.6 | 80 | 35.5 | 1,486 |
| 36 |
 Michael Adams |
DEN | 18.5 | 77 | 36.2 | 1,424 |
| 37 |
 Reggie Lewis |
BOS | 18.5 | 81 | 32.8 | 1,495 |
| 38 |
 Isiah Thomas |
DET | 18.2 | 80 | 36.6 | 1,458 |
| 39 | Kevin Duckworth | POR | 18.1 | 79 | 33.7 | 1,432 |
| 40 | Ken Norman | LAC | 18.1 | 80 | 37.8 | 1,450 |
| 41 |
 Terry Porter |
POR | 17.7 | 81 | 38.3 | 1,431 |
| 42 |
 Ricky Pierce |
MIL | 17.6 | 75 | 27.7 | 1,317 |
| 43 |
 Danny Ainge |
SAC | 17.5 | 73 | 32.6 | 1,281 |
| 44 |
 Jerome Kersey |
POR | 17.5 | 76 | 35.7 | 1,330 |
| 45 |
 Wayman Tisdale |
SAC | 17.5 | 79 | 30.8 | 1,381 |
| 46 |
 Derek Harper |
DAL | 17.3 | 81 | 36.6 | 1,404 |
| 47 |
 Kenny Smith |
SAC | 17.3 | 81 | 38.8 | 1,403 |
| 48 |
 Alvin Robertson |
SAN | 17.3 | 65 | 35.2 | 1,122 |
| 49 |
 Larry Nance |
CLE | 17.2 | 73 | 34.6 | 1,259 |
| 50 | Joe Dumars | DET | 17.2 | 69 | 34.9 | 1,186 |
1–50 of 229Next →