

1990-1991 NBA Points per Game Leaders
Points scored per game
Michael Jordan led the NBA in points per game with 31.5 in the 1990-1991 season, 2.5 ahead of Karl Malone (29.0). It stands 38th among all single seasons in NBA history. It was one of 10 times Michael Jordan led in points per game.
Showing players who met the games-played minimum for the season. Show all players
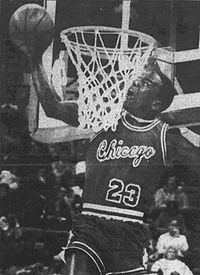 Led the NBA in 1990-1991
Michael Jordan
CHI
31.5
Points per Game
2.5 clear of Karl Malone
Showing Points per Game and the stats that give it context
Full stat line
| # | Player | Team | PPG | GP | MPG | PTS |
|---|---|---|---|---|---|---|
| 1 |
 Michael Jordan |
CHI | 31.5 | 82 | 37.0 | 2,580 |
| 2 |
 Karl Malone |
UTH | 29.0 | 82 | 40.3 | 2,382 |
| 3 |
 Bernard King |
WAS | 28.4 | 64 | 37.5 | 1,817 |
| 4 |
 Charles Barkley |
PHL | 27.6 | 67 | 37.3 | 1,849 |
| 5 |
 Patrick Ewing |
NYK | 26.6 | 81 | 38.3 | 2,154 |
| 6 |
 Michael Adams |
DEN | 26.5 | 66 | 35.5 | 1,752 |
| 7 |
 Dominique Wilkins |
ATL | 25.9 | 81 | 38.0 | 2,101 |
| 8 |
 Chris Mullin |
GOS | 25.7 | 82 | 40.4 | 2,107 |
| 9 |
 David Robinson |
SAN | 25.6 | 82 | 37.7 | 2,101 |
| 10 |
 Mitch Richmond |
GOS | 23.9 | 77 | 39.3 | 1,840 |
| 11 |
 Tim Hardaway |
GOS | 22.9 | 82 | 39.2 | 1,881 |
| 12 |
 Reggie Miller |
IND | 22.6 | 82 | 36.2 | 1,855 |
| 13 |
 Kevin Johnson |
PHX | 22.2 | 77 | 36.0 | 1,710 |
| 14 |
 Hersey Hawkins |
PHL | 22.1 | 80 | 38.9 | 1,767 |
| 15 | Tony Campbell | MIN | 21.8 | 77 | 37.6 | 1,678 |
| 16 | Brad Daugherty | CLE | 21.6 | 76 | 38.8 | 1,645 |
| 17 |
 Clyde Drexler |
POR | 21.5 | 82 | 34.8 | 1,767 |
| 18 |
 James Worthy |
LAL | 21.4 | 78 | 38.6 | 1,670 |
| 19 |
 Ricky Pierce |
SEA | 20.5 | 78 | 27.8 | 1,598 |
| 20 | Joe Dumars | DET | 20.4 | 80 | 38.1 | 1,629 |
| 21 | Antoine Carr | SAC | 20.1 | 77 | 32.8 | 1,551 |
| 22 |
 Charles Smith |
LAC | 20.0 | 74 | 36.5 | 1,480 |
| 23 | Tom Chambers | PHX | 19.9 | 76 | 32.6 | 1,511 |
| 24 | Rolando Blackman | DAL | 19.9 | 80 | 37.1 | 1,590 |
| 25 |
 Derek Harper |
DAL | 19.7 | 77 | 37.4 | 1,519 |
| 26 |
 Larry Bird |
BOS | 19.4 | 60 | 38.0 | 1,164 |
| 27 |
 Magic Johnson |
LAL | 19.4 | 79 | 37.1 | 1,531 |
| 28 |
 Larry Nance |
CLE | 19.2 | 80 | 36.6 | 1,537 |
| 29 |
 Reggie Lewis |
BOS | 18.7 | 79 | 36.4 | 1,478 |
| 30 |
 Reggie Theus |
NJN | 18.6 | 81 | 36.5 | 1,510 |
| 31 |
 Jeff Malone |
UTH | 18.6 | 69 | 35.7 | 1,282 |
| 32 | Sherman Douglas | MIA | 18.5 | 73 | 35.1 | 1,352 |
| 33 |
 Derrick Coleman |
NJN | 18.4 | 74 | 35.2 | 1,364 |
| 34 | Chuck Person | IND | 18.4 | 80 | 32.1 | 1,474 |
| 35 |
 Kevin McHale |
BOS | 18.4 | 68 | 30.4 | 1,251 |
| 36 | Harvey Grant | WAS | 18.2 | 77 | 36.9 | 1,405 |
| 37 | Lionel Simmons | SAC | 18.0 | 79 | 37.7 | 1,421 |
| 38 |
 Tyrone Corbin |
MIN | 18.0 | 82 | 39.0 | 1,472 |
| 39 |
 Scottie Pippen |
CHI | 17.8 | 82 | 36.8 | 1,461 |
| 40 |
 Kenny Smith |
HOU | 17.7 | 78 | 34.6 | 1,380 |
| 41 |
 Terry Cummings |
SAN | 17.6 | 67 | 32.8 | 1,177 |
| 42 |
 Otis Thorpe |
HOU | 17.5 | 82 | 37.1 | 1,435 |
| 43 |
 Glen Rice |
MIA | 17.4 | 77 | 34.4 | 1,342 |
| 44 | Ken Norman | LAC | 17.4 | 70 | 33.0 | 1,219 |
| 45 |
 John Stockton |
UTH | 17.2 | 82 | 37.8 | 1,413 |
| 46 |
 Scott Skiles |
ORL | 17.2 | 79 | 34.4 | 1,357 |
| 47 | Pooh Richardson | MIN | 17.1 | 82 | 38.5 | 1,401 |
| 48 |
 Terry Porter |
POR | 17.0 | 81 | 32.9 | 1,381 |
| 49 |
 Vernon Maxwell |
HOU | 17.0 | 82 | 35.0 | 1,397 |
| 50 | Xavier McDaniel | PHX | 17.0 | 81 | 32.5 | 1,373 |
1–50 of 247Next →