

2000 NFC Interception Percentage Leaders
Interceptions per pass attempt
Jeff Garcia led the NFC in interception percentage in 2000 with 1.8%, 0.3 percentage points ahead of Trent Green (2.1%).
Showing players who met 14 pass attempts per team game. Show all players
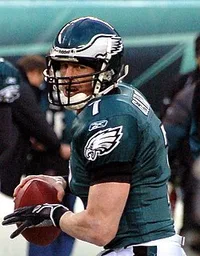 Led the NFC in 2000
Jeff Garcia
San Francisco 49ers
1.8%
Interception Percentage
0.3% clear of Trent Green
Showing Interception Percentage and the stats that give it context
Full stat line
| # | Player | Team | INT% | G | ATT | YDS | TD |
|---|---|---|---|---|---|---|---|
| 1 |
 Jeff Garcia |
SF | 1.8% | 16 | 561 | 4,278 | 31 |
| 2 |
 Trent Green |
LA | 2.1% | 8 | 240 | 2,063 | 16 |
| 3 |
 Donovan McNabb |
PHI | 2.3% | 16 | 569 | 3,365 | 21 |
| 4 |
 Kerry Collins |
NYG | 2.5% | 16 | 529 | 3,610 | 22 |
| 5 |
 Brett Favre |
GB | 2.8% | 16 | 580 | 3,812 | 20 |
| 6 |
 Jeff Blake |
NO | 3.0% | 11 | 302 | 2,025 | 13 |
| 7 | Shaun King | TB | 3.0% | 16 | 428 | 2,769 | 18 |
| 8 | Cade McNown | CHI | 3.2% | 10 | 280 | 1,646 | 8 |
| 9 |
 Daunte Culpepper |
MIN | 3.4% | 16 | 474 | 3,937 | 33 |
| 10 |
 Steve Beuerlein |
CAR | 3.4% | 16 | 533 | 3,730 | 19 |
| 11 |
 Chris Chandler |
ATL | 3.6% | 14 | 331 | 2,236 | 10 |
| 12 |
 Charlie Batch |
DET | 3.6% | 15 | 412 | 2,489 | 13 |
| 13 |
 Brad Johnson |
WAS | 4.1% | 12 | 363 | 2,505 | 11 |
| 14 |
 Jake Plummer |
ARI | 4.4% | 14 | 475 | 2,946 | 13 |
| 15 |
 Jon Kitna |
SEA | 4.5% | 15 | 418 | 2,658 | 18 |
| 16 |
 Kurt Warner |
LA | 5.2% | 11 | 347 | 3,429 | 21 |
| 17 |
 Troy Aikman |
DAL | 5.3% | 11 | 262 | 1,632 | 7 |