

2002 NFC Receiving Yards per Game Leaders
Receiving yards per game played
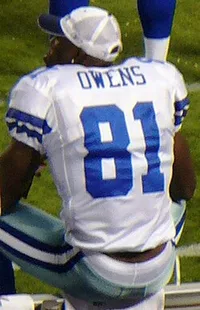
Terrell Owens led the NFC in receiving yards per game with 92.9 in 2002, 8.7 ahead of Randy Moss (84.2).
Showing players who met 1.875 receptions per team game. Show all players
 Led the NFC in 2002
Terrell Owens
San Francisco 49ers
92.9
Receiving Yards per Game
8.7 clear of Randy Moss
Showing Receiving Yards per Game and the stats that give it context
Full stat line
| # | Player | Team | Y/G | G | REC | YDS | TD |
|---|---|---|---|---|---|---|---|
| 1 |
 Terrell Owens |
SF | 92.9 | 14 | 100 | 1,300 | 13 |
| 2 |
 Randy Moss |
MIN | 84.2 | 16 | 106 | 1,347 | 7 |
| 3 |
 Amani Toomer |
NYG | 83.9 | 16 | 82 | 1,343 | 8 |
| 4 |
 Joe Horn |
NO | 82.0 | 16 | 88 | 1,312 | 7 |
| 5 |
 Torry Holt |
LA | 81.4 | 16 | 91 | 1,302 | 4 |
| 6 | Koren Robinson | SEA | 77.5 | 16 | 78 | 1,240 | 5 |
| 7 |
 Marty Booker |
CHI | 74.3 | 16 | 97 | 1,189 | 6 |
| 8 |
 Keyshawn Johnson |
TB | 68.0 | 16 | 76 | 1,088 | 5 |
| 9 |
 Darrell Jackson |
SEA | 67.5 | 13 | 62 | 877 | 4 |
| 10 |
 Isaac Bruce |
LA | 67.2 | 16 | 79 | 1,075 | 7 |
| 11 |
 Donald Driver |
GB | 66.5 | 16 | 70 | 1,064 | 9 |
| 12 |
 David Boston |
ARI | 64.0 | 8 | 32 | 512 | 1 |
| 13 | Rod Gardner | WAS | 62.9 | 16 | 71 | 1,006 | 8 |
| 14 |
 Jeremy Shockey |
NYG | 59.6 | 15 | 74 | 894 | 2 |
| 15 |
 Muhsin Muhammad |
CAR | 58.8 | 14 | 63 | 823 | 3 |
| 16 |
 Steve Smith |
CAR | 58.1 | 15 | 54 | 872 | 3 |
| 17 |
 Joey Galloway |
DAL | 56.8 | 16 | 61 | 908 | 6 |
| 18 |
 Terry Glenn |
GB | 54.5 | 15 | 56 | 817 | 2 |
| 19 | Az-Zahir Hakim | DET | 54.1 | 10 | 37 | 541 | 3 |
| 20 | Todd Pinkston | PHI | 53.2 | 15 | 60 | 798 | 7 |
| 21 |
 Brian Finneran |
ATL | 52.4 | 16 | 56 | 838 | 6 |
| 22 | Tai Streets | SF | 50.4 | 15 | 72 | 756 | 5 |
| 23 | D'Wayne Bates | MIN | 49.2 | 14 | 50 | 689 | 4 |
| 24 |
 Derrius Thompson |
WAS | 48.3 | 16 | 53 | 773 | 4 |
| 25 |
 Keenan McCardell |
TB | 47.9 | 14 | 61 | 670 | 6 |
| 26 |
 Antonio Bryant |
DAL | 45.8 | 16 | 44 | 733 | 6 |
| 27 |
 Donte' Stallworth |
NO | 45.7 | 13 | 42 | 594 | 8 |
| 28 | Bill Schroeder | DET | 42.5 | 14 | 36 | 595 | 5 |
| 29 |
 Bobby Engram |
SEA | 41.3 | 15 | 50 | 619 | 0 |
| 30 | Dez White | CHI | 41.0 | 16 | 51 | 656 | 4 |
| 31 |
 Antonio Freeman |
PHI | 40.0 | 15 | 46 | 600 | 4 |
| 32 |
 James Thrash |
PHI | 39.7 | 16 | 52 | 635 | 6 |
| 33 |
 Marshall Faulk |
LA | 38.4 | 14 | 80 | 537 | 2 |
| 34 | Jerome Pathon | NO | 37.4 | 14 | 43 | 523 | 4 |
| 35 |
 Tiki Barber |
NYG | 37.3 | 16 | 69 | 597 | 0 |
| 36 | Frank Sanders | ARI | 36.4 | 11 | 34 | 400 | 2 |
| 37 | Itula Mili | SEA | 33.9 | 15 | 43 | 508 | 2 |
| 38 | Duce Staley | PHI | 33.8 | 16 | 51 | 541 | 3 |
| 39 |
 Joe Jurevicius |
TB | 32.5 | 13 | 37 | 423 | 4 |
| 40 | Ricky Proehl | LA | 31.1 | 15 | 43 | 466 | 4 |
| 41 | Byron Chamberlain | MIN | 29.9 | 13 | 34 | 389 | 0 |
| 42 | Michael Pittman | TB | 29.8 | 16 | 59 | 477 | 0 |
| 43 |
 Shaun Alexander |
SEA | 28.8 | 16 | 59 | 460 | 2 |
| 44 |
 Alge Crumpler |
ATL | 28.4 | 16 | 36 | 455 | 5 |
| 45 |
 Ahman Green |
GB | 28.1 | 14 | 57 | 393 | 2 |
| 46 |
 Jimmy Kleinsasser |
MIN | 28.1 | 14 | 37 | 393 | 1 |
| 47 | J.J. Stokes | SF | 27.7 | 12 | 32 | 332 | 1 |
| 48 |
 Bubba Franks |
GB | 27.6 | 16 | 54 | 442 | 7 |
| 49 | Marcel Shipp | ARI | 27.5 | 15 | 38 | 413 | 3 |
| 50 | Eric Johnson | SF | 26.8 | 12 | 36 | 321 | 0 |
1–50 of 63Next →