

2000 WNBA Free Throws Attempted Leaders
Free throws attempted
Natalie Williams led the WNBA in free throws attempted in 2000 with 228, 23 ahead of Lisa Leslie (205). It stands 30th among all single seasons in WNBA history.
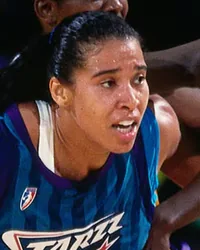 Led the WNBA in 2000
Natalie Williams
UTA
228
Free Throws Attempted
23 clear of Lisa Leslie
Showing Free Throws Attempted and the stats that give it context
Full stat line
| # | Player | Team | FTA | GP | FGM | FGA | FG% |
|---|---|---|---|---|---|---|---|
| 1 |
 Natalie Williams |
UTA | 228 | 29 | 179 | 365 | 49.0% |
| 2 |
 Lisa Leslie |
LAS | 205 | 32 | 197 | 430 | 45.8% |
| 3 |
 Yolanda Griffith |
SAC | 194 | 32 | 193 | 361 | 53.5% |
| 4 |
 Katie Smith |
MIN | 175 | 32 | 203 | 482 | 42.1% |
| 5 |
 Cynthia Cooper |
HOU | 168 | 31 | 180 | 392 | 45.9% |
| 6 |
 Nikki McCray |
WAS | 147 | 32 | 167 | 385 | 43.4% |
| 7 |
 Sheryl Swoopes |
HOU | 145 | 31 | 245 | 484 | 50.6% |
| 8 | Shannon Johnson | ORL | 144 | 32 | 122 | 309 | 39.5% |
| 9 | Brandy Reed | PHO | 142 | 32 | 231 | 456 | 50.7% |
| 10 |
 Chasity Melvin |
CLE | 137 | 32 | 136 | 289 | 47.1% |
| 11 |
 Wendy Palmer |
DET | 135 | 32 | 167 | 373 | 44.8% |
| 12 |
 Andrea Stinson |
CHA | 134 | 32 | 214 | 463 | 46.2% |
| 13 |
 Adrienne Goodson |
UTA | 134 | 29 | 199 | 415 | 48.0% |
| 14 |
 Dominique Canty |
DET | 131 | 28 | 83 | 203 | 40.9% |
| 15 |
 Tari Phillips |
NYL | 130 | 31 | 170 | 364 | 46.7% |
| 16 |
 Chamique Holdsclaw |
WAS | 128 | 32 | 232 | 499 | 46.5% |
| 17 |
 Tina Thompson |
HOU | 123 | 32 | 191 | 407 | 46.9% |
| 18 |
 Taj McWilliams-Franklin |
ORL | 122 | 32 | 173 | 330 | 52.4% |
| 19 |
 Ticha Penicheiro |
SAC | 107 | 30 | 68 | 185 | 36.8% |
| 20 |
 Jennifer Gillom |
PHO | 106 | 30 | 139 | 316 | 44.0% |
| 21 |
 Betty Lennox |
MIN | 105 | 32 | 201 | 471 | 42.7% |
| 22 |
 Margo Dydek |
UTA | 103 | 32 | 105 | 236 | 44.5% |
| 23 |
 DeLisha Milton-Jones |
LAS | 102 | 32 | 150 | 293 | 51.2% |
| 24 |
 Sylvia Crawley |
POR | 102 | 31 | 143 | 298 | 48.0% |
| 25 |
 Sheri Sam |
MIA | 100 | 31 | 147 | 380 | 38.7% |
| 26 | Kristin Folkl | MIN | 94 | 32 | 86 | 191 | 45.0% |
| 27 | Elena Tornikidou | DET | 93 | 32 | 122 | 241 | 50.6% |
| 28 |
 Murriel Page |
WAS | 92 | 32 | 131 | 222 | 59.0% |
| 29 | Mwadi Mabika | LAS | 89 | 32 | 130 | 335 | 38.8% |
| 30 |
 Tamika Whitmore |
NYL | 84 | 32 | 109 | 253 | 43.1% |
| 31 |
 Ruthie Bolton |
SAC | 84 | 29 | 133 | 368 | 36.1% |
| 32 |
 Teresa Weatherspoon |
NYL | 81 | 32 | 67 | 153 | 43.8% |
| 33 | Mery Andrade | CLE | 80 | 32 | 89 | 195 | 45.6% |
| 34 | Edwina Brown | DET | 80 | 32 | 60 | 168 | 35.7% |
| 35 |
 Simone Edwards |
SEA | 80 | 29 | 83 | 182 | 45.6% |
| 36 | Kamila Vodichkova | SEA | 78 | 23 | 68 | 171 | 39.8% |
| 37 |
 Tamecka Dixon |
LAS | 77 | 31 | 132 | 291 | 45.4% |
| 38 |
 Vickie Johnson |
NYL | 76 | 31 | 143 | 324 | 44.1% |
| 39 | Michelle Marciniak | POR | 75 | 32 | 58 | 154 | 37.7% |
| 40 |
 Dawn Staley |
CHA | 74 | 32 | 94 | 253 | 37.2% |
| 41 | Stacey Thomas | POR | 74 | 32 | 58 | 163 | 35.6% |
| 42 | Tully Bevilaqua | POR | 72 | 32 | 40 | 112 | 35.7% |
| 43 |
 Allison Feaster |
LAS | 72 | 32 | 60 | 167 | 35.9% |
| 44 |
 Becky Hammon |
NYL | 69 | 32 | 119 | 252 | 47.2% |
| 45 | Kedra Holland-Corn | SAC | 66 | 32 | 111 | 253 | 43.9% |
| 46 | Helen Darling | CLE | 65 | 32 | 47 | 150 | 31.3% |
| 47 |
 Ukari Figgs |
LAS | 65 | 32 | 66 | 153 | 43.1% |
| 48 | Grace Daley | MIN | 65 | 30 | 57 | 147 | 38.8% |
| 49 | Kristen Rasmussen | MIA | 64 | 26 | 35 | 100 | 35.0% |
| 50 | Vicky Bullett | WAS | 63 | 32 | 143 | 294 | 48.6% |
1–50 of 160Next →