

1930 MLB Catcher Range Factor Leaders
Putouts plus assists per game at catcher
Tom Young led the majors in catcher range factor with 6.71 in 1930, 0.49 ahead of Bill Perkins (6.22). It was one of 2 times Tom Young led in catcher range factor.
Showing players with at least 29 games at the position — the fielding-title rule of half of the team's games. Show all players
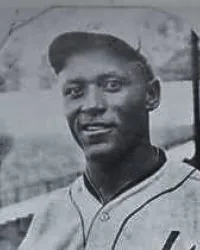 Led all of MLB in 1930
Tom Young
Kansas City Monarchs
6.71
Catcher Range Factor
0.49 clear of Bill Perkins
Showing Catcher Range Factor and the stats that give it context
Full stat line
| # | Player | Team | C RF | G | PO | A | E |
|---|---|---|---|---|---|---|---|
| 1 |
 Tom Young |
KCM | 6.71 | 48 | 279 | 43 | 9 |
| 2 |
 Bill Perkins |
BBB | 6.22 | 60 | 320 | 53 | 20 |
| 3 |
 Ted Radcliffe |
SLS | 5.73 | 55 | 267 | 48 | 13 |
| 4 |
 Mickey Cochrane |
PHA | 5.56 | 130 | 654 | 69 | 5 |
| 5 |
 Henry Williams |
SLS | 5.39 | 46 | 205 | 43 | 6 |
| 6 |
 Jimmie Wilson |
SLN | 5.28 | 99 | 456 | 67 | 7 |
| 7 | John Barnes | MRS | 5.26 | 46 | 213 | 29 | 6 |
| 8 |
 Gabby Hartnett |
CHN | 5.25 | 136 | 646 | 68 | 8 |
| 9 |
 Roy Spencer |
WS1 | 4.72 | 93 | 395 | 44 | 5 |
| 10 |
 Bill Dickey |
NYA | 4.64 | 101 | 418 | 51 | 11 |
| 11 |
 Shanty Hogan |
NY1 | 4.50 | 96 | 386 | 46 | 8 |
| 12 |
 Aurelio Cortés |
CSW | 4.47 | 34 | 132 | 20 | 6 |
| 13 |
 Al Lopez |
BRO | 4.21 | 126 | 465 | 66 | 9 |
| 14 |
 Rick Ferrell |
SLA | 3.98 | 101 | 336 | 66 | 7 |
| 15 |
 Charlie Berry |
BOS | 3.94 | 85 | 279 | 56 | 4 |
| 16 |
 Rollie Hemsley |
PIT | 3.83 | 98 | 325 | 50 | 8 |
| 17 |
 Virgil Davis |
PHI | 3.72 | 96 | 307 | 50 | 5 |
| 18 |
 Johnny Gooch |
CIN | 3.48 | 79 | 233 | 42 | 13 |
| 19 |
 Bennie Tate |
CHA | 3.46 | 79 | 231 | 42 | 6 |
| 20 |
 Clyde Sukeforth |
CIN | 3.41 | 82 | 234 | 46 | 7 |
| 21 |
 Al Spohrer |
BSN | 3.31 | 108 | 322 | 36 | 16 |