

1940 NL Winning Percentage Leaders
Wins per decision
Rip Sewell led the NL in winning percentage with .762 in 1940, 74 points ahead of Bucky Walters (.688).
Showing pitchers with at least 156.0 innings — the standard 1.0 inning per team game. Show all players
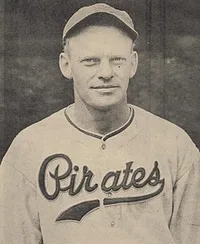 Led the NL in 1940
Rip Sewell
Pittsburgh Pirates
.762
Winning Percentage
.074 clear of Bucky Walters
Showing Winning Percentage and the stats that give it context
Full stat line
| # | Player | Team | W-L% | W | L | ERA | IP |
|---|---|---|---|---|---|---|---|
| 1 |
 Rip Sewell |
PIT | .762 | 16 | 5 | 2.80 | 189.2 |
| 2 |
 Bucky Walters |
CIN | .688 | 22 | 10 | 2.48 | 305.0 |
| 3 |
 Jim Turner |
CIN | .667 | 14 | 7 | 2.89 | 187.0 |
| 4 |
 Gene Thompson |
CIN | .640 | 16 | 9 | 3.32 | 225.1 |
| 5 |
 Paul Derringer |
CIN | .625 | 20 | 12 | 3.06 | 296.2 |
| 6 | Bill McGee | SLN | .615 | 16 | 10 | 3.80 | 218.0 |
| 7 |
 Lon Warneke |
SLN | .615 | 16 | 10 | 3.14 | 232.0 |
| 8 |
 Claude Passeau |
CHN | .606 | 20 | 13 | 2.50 | 280.2 |
| 9 | Vern Olsen | CHN | .591 | 13 | 9 | 2.97 | 172.2 |
| 10 |
 Clyde Shoun |
SLN | .542 | 13 | 11 | 3.92 | 197.1 |
| 11 |
 Luke Hamlin |
BRO | .529 | 9 | 8 | 3.06 | 182.1 |
| 12 |
 Mace Brown |
PIT | .526 | 10 | 9 | 3.49 | 173.0 |
| 13 |
 Manny Salvo |
BSN | .526 | 10 | 9 | 3.08 | 160.2 |
| 14 |
 Whit Wyatt |
BRO | .517 | 15 | 14 | 3.46 | 239.1 |
| 15 |
 Larry French |
CHN | .500 | 14 | 14 | 3.29 | 246.0 |
| 16 |
 Ken Heintzelman |
PIT | .500 | 8 | 8 | 4.47 | 165.0 |
| 17 |
 Hal Schumacher |
NY1 | .500 | 13 | 13 | 3.25 | 227.0 |
| 18 |
 Dick Errickson |
BSN | .480 | 12 | 13 | 3.16 | 236.1 |
| 19 |
 Mort Cooper |
SLN | .478 | 11 | 12 | 3.63 | 230.2 |
| 20 |
 Carl Hubbell |
NY1 | .478 | 11 | 12 | 3.65 | 214.1 |
| 21 |
 Cliff Melton |
NY1 | .476 | 10 | 11 | 4.91 | 166.2 |
| 22 |
 Joe Bowman |
PIT | .474 | 9 | 10 | 4.46 | 187.2 |
| 23 |
 Harry Gumbert |
NY1 | .462 | 12 | 14 | 3.76 | 237.0 |
| 24 |
 Kirby Higbe |
PHI | .424 | 14 | 19 | 3.72 | 283.0 |
| 25 |
 Curt Davis |
BRO +1 | .421 | 8 | 11 | 4.19 | 191.0 |
| 26 |
 Joe Sullivan |
BSN | .417 | 10 | 14 | 3.55 | 177.1 |
| 27 |
 Bill Posedel |
BSN | .414 | 12 | 17 | 4.13 | 233.0 |
| 28 |
 Bill Lohrman |
NY1 | .400 | 10 | 15 | 3.78 | 195.0 |
| 29 |
 Hugh Mulcahy |
PHI | .371 | 13 | 22 | 3.60 | 280.0 |
| 30 |
 Bill Lee |
CHN | .346 | 9 | 17 | 5.03 | 211.1 |