

1984 NFC Yards per Reception Leaders
Receiving yards per catch
James Lofton led the NFC in yards per reception in 1984 with 21.95, 0.07 ahead of Mark Nichols (21.88). It was one of 4 times James Lofton led in yards per reception.
Showing players who met 1.875 receptions per team game. Show all players
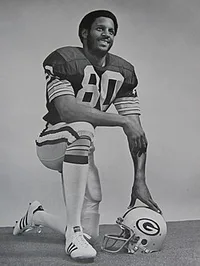 Led the NFC in 1984
James Lofton
GB
21.95
Yards per Reception
0.07 clear of Mark Nichols
Showing Yards per Reception and the stats that give it context
Full stat line
| # | Player | Team | Y/R | G | REC | YDS | TD |
|---|---|---|---|---|---|---|---|
| 1 |
 James Lofton |
GB | 21.95 | 16 | 62 | 1,361 | 7 |
| 2 | Mark Nichols | DET | 21.88 | 15 | 34 | 744 | 1 |
| 3 |
 Roy Green |
SLC | 19.94 | 16 | 78 | 1,555 | 12 |
| 4 | Lionel Manuel | NYG | 18.76 | 16 | 33 | 619 | 4 |
| 5 |
 Freddie Solomon |
SF | 18.43 | 14 | 40 | 737 | 10 |
| 6 |
 Henry Ellard |
LAN | 18.29 | 16 | 34 | 622 | 6 |
| 7 | Leo Lewis | MIN | 17.66 | 16 | 47 | 830 | 4 |
| 8 | Calvin Muhammad | WAS | 17.36 | 10 | 42 | 729 | 4 |
| 9 |
 Willie Gault |
CHI | 17.26 | 16 | 34 | 587 | 6 |
| 10 |
 Mike Quick |
PHI | 17.25 | 14 | 61 | 1,052 | 9 |
| 11 | Stacey Bailey | ATL | 16.99 | 16 | 67 | 1,138 | 6 |
| 12 |
 Dwight Clark |
SF | 16.92 | 16 | 52 | 880 | 6 |
| 13 | Mike Renfro | DAL | 16.66 | 16 | 35 | 583 | 2 |
| 14 | Bobby Johnson | NYG | 16.56 | 16 | 48 | 795 | 7 |
| 15 | Tony Woodruff | PHI | 16.13 | 16 | 30 | 484 | 3 |
| 16 | Doug Marsh | SLC | 15.59 | 16 | 39 | 608 | 5 |
| 17 | Mike Jones | MIN | 15.55 | 16 | 38 | 591 | 1 |
| 18 | Leonard Thompson | DET | 15.46 | 16 | 50 | 773 | 6 |
| 19 |
 Tony Hill |
DAL | 14.90 | 11 | 58 | 864 | 5 |
| 20 | Doug Donley | DAL | 14.78 | 15 | 32 | 473 | 2 |
| 21 | Jeff Groth | NO | 14.76 | 16 | 33 | 487 | 0 |
| 22 | Jeff Chadwick | DET | 14.59 | 16 | 37 | 540 | 2 |
| 23 |
 Pat Tilley |
SLC | 14.58 | 16 | 52 | 758 | 5 |
| 24 | Zeke Mowatt | NYG | 14.54 | 16 | 48 | 698 | 6 |
| 25 | Alfred Jackson | ATL | 14.06 | 16 | 52 | 731 | 2 |
| 26 |
 Earnest Gray |
NYG | 13.92 | 12 | 38 | 529 | 2 |
| 27 | Gerald Carter | TB | 13.60 | 16 | 60 | 816 | 5 |
| 28 |
 Kevin House |
TB | 13.22 | 16 | 76 | 1,005 | 5 |
| 29 | Doug Cosbie | DAL | 13.15 | 16 | 60 | 789 | 4 |
| 30 | Paul Coffman | GB | 13.07 | 14 | 43 | 562 | 9 |
| 31 |
 Art Monk |
WAS | 12.94 | 16 | 106 | 1,372 | 7 |
| 32 |
 Clint Didier |
WAS | 11.67 | 11 | 30 | 350 | 5 |
| 33 | Earl Cooper | SF | 11.20 | 16 | 41 | 459 | 4 |
| 34 | Steve Jordan | MIN | 10.89 | 14 | 38 | 414 | 2 |
| 35 | John Spagnola | PHI | 10.78 | 16 | 65 | 701 | 1 |
| 36 | Ron Springs | DAL | 9.87 | 16 | 46 | 454 | 3 |
| 37 | David Hill | LAN | 9.68 | 16 | 31 | 300 | 1 |
| 38 | Arthur Cox | ATL | 9.68 | 16 | 34 | 329 | 3 |
| 39 |
 Tony Galbreath |
NYG | 9.65 | 16 | 37 | 357 | 0 |
| 40 | Wayne Wilson | NO | 9.52 | 14 | 33 | 314 | 3 |
| 41 |
 Roger Craig |
SF | 9.51 | 16 | 71 | 675 | 3 |
| 42 |
 Tony Dorsett |
DAL | 9.00 | 16 | 51 | 459 | 1 |
| 43 |
 Ottis Anderson |
SLC | 8.73 | 15 | 70 | 611 | 2 |
| 44 |
 Gerry Ellis |
GB | 8.67 | 16 | 36 | 312 | 2 |
| 45 |
 James Jones |
DET | 8.60 | 16 | 77 | 662 | 5 |
| 46 |
 Wilbert Montgomery |
PHI | 8.35 | 16 | 60 | 501 | 0 |
| 47 | Hokie Gajan | NO | 8.23 | 14 | 35 | 288 | 2 |
| 48 |
 Walter Payton |
CHI | 8.18 | 16 | 45 | 368 | 0 |
| 49 |
 James Wilder |
TB | 8.06 | 16 | 85 | 685 | 0 |
| 50 |
 Billy Sims |
DET | 7.71 | 8 | 31 | 239 | 0 |
1–50 of 55Next →