

1990 NFC Yards per Reception Leaders
Receiving yards per catch
Flipper Anderson led the NFC in yards per reception with 21.51 in 1990, 1.48 ahead of Fred Barnett (20.03). It was one of 2 times Flipper Anderson led in yards per reception.
Showing players who met 1.875 receptions per team game. Show all players
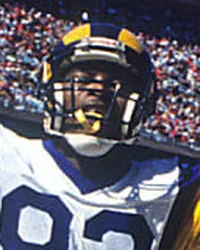 Led the NFC in 1990
Flipper Anderson
LAN
21.51
Yards per Reception
1.48 clear of Fred Barnett
Showing Yards per Reception and the stats that give it context
Full stat line
| # | Player | Team | Y/R | G | REC | YDS | TD |
|---|---|---|---|---|---|---|---|
| 1 |
 Flipper Anderson |
LAN | 21.51 | 16 | 51 | 1,097 | 4 |
| 2 |
 Fred Barnett |
PHI | 20.03 | 16 | 36 | 721 | 8 |
| 3 | Robert Clark | DET | 17.58 | 16 | 52 | 914 | 8 |
| 4 |
 Henry Ellard |
LAN | 17.03 | 15 | 76 | 1,294 | 4 |
| 5 | Ernie Jones | PHO | 16.84 | 15 | 43 | 724 | 4 |
| 6 | Mark Carrier | TB | 16.59 | 16 | 49 | 813 | 4 |
| 7 |
 Sterling Sharpe |
GB | 16.49 | 16 | 67 | 1,105 | 6 |
| 8 | Calvin Williams | PHI | 16.27 | 16 | 37 | 602 | 9 |
| 9 | Hassan Jones | MIN | 15.88 | 15 | 51 | 810 | 7 |
| 10 |
 John Taylor |
SF | 15.27 | 14 | 49 | 748 | 7 |
| 11 | Bruce Hill | TB | 15.26 | 13 | 42 | 641 | 5 |
| 12 |
 Roy Green |
PHO | 15.04 | 16 | 53 | 797 | 4 |
| 13 |
 Jerry Rice |
SF | 15.02 | 16 | 100 | 1,502 | 13 |
| 14 | Ron Hall | TB | 14.97 | 16 | 31 | 464 | 2 |
| 15 |
 Gary Clark |
WAS | 14.83 | 16 | 75 | 1,112 | 8 |
| 16 | Shawn Collins | ATL | 14.79 | 16 | 34 | 503 | 2 |
| 17 |
 Andre Rison |
ATL | 14.73 | 16 | 82 | 1,208 | 10 |
| 18 | Wendell Davis | CHI | 14.67 | 14 | 39 | 572 | 3 |
| 19 |
 Eric Martin |
NO | 14.48 | 16 | 63 | 912 | 5 |
| 20 |
 Anthony Carter |
MIN | 14.40 | 15 | 70 | 1,008 | 8 |
| 21 |
 Michael Haynes |
ATL | 14.35 | 13 | 31 | 445 | 0 |
| 22 | Ricky Proehl | PHO | 14.32 | 16 | 56 | 802 | 4 |
| 23 | Steve Jordan | MIN | 14.13 | 16 | 45 | 636 | 3 |
| 24 | Ron Morris | CHI | 14.10 | 15 | 31 | 437 | 3 |
| 25 | Jeff Query | GB | 13.47 | 16 | 34 | 458 | 2 |
| 26 | Keith Jackson | PHI | 13.40 | 14 | 50 | 670 | 6 |
| 27 | Brent Jones | SF | 13.34 | 16 | 56 | 747 | 5 |
| 28 |
 Barry Sanders |
DET | 13.33 | 16 | 36 | 480 | 3 |
| 29 |
 Ricky Sanders |
WAS | 12.98 | 16 | 56 | 727 | 3 |
| 30 |
 Gary Anderson |
TB | 12.21 | 16 | 38 | 464 | 2 |
| 31 | Perry Kemp | GB | 11.98 | 16 | 44 | 527 | 2 |
| 32 | Mark Bavaro | NYG | 11.91 | 15 | 33 | 393 | 5 |
| 33 | Clarence Weathers | GB | 11.82 | 14 | 33 | 390 | 1 |
| 34 | Aubrey Matthews | DET | 11.63 | 13 | 30 | 349 | 1 |
| 35 | Neal Anderson | CHI | 11.52 | 15 | 42 | 484 | 3 |
| 36 | Kelvin Martin | DAL | 11.44 | 16 | 64 | 732 | 0 |
| 37 | Richard Johnson | DET | 11.36 | 16 | 64 | 727 | 6 |
| 38 |
 Art Monk |
WAS | 11.32 | 16 | 68 | 770 | 5 |
| 39 | Jay Novacek | DAL | 11.14 | 16 | 59 | 657 | 4 |
| 40 | Brett Perriman | NO | 10.61 | 16 | 36 | 382 | 2 |
| 41 | Dave Meggett | NYG | 10.51 | 16 | 39 | 410 | 1 |
| 42 | Floyd Dixon | ATL | 10.50 | 16 | 38 | 399 | 4 |
| 43 |
 Keith Byars |
PHI | 10.11 | 16 | 81 | 819 | 3 |
| 44 | Pete Holohan | LAN | 9.69 | 16 | 49 | 475 | 2 |
| 45 | Brad Muster | CHI | 9.62 | 16 | 47 | 452 | 0 |
| 46 | Herman Fontenot | GB | 9.45 | 14 | 31 | 293 | 1 |
| 47 | Tommie Agee | DAL | 9.07 | 16 | 30 | 272 | 1 |
| 48 |
 Earnest Byner |
WAS | 9.00 | 16 | 31 | 279 | 1 |
| 49 |
 Herschel Walker |
MIN | 9.00 | 16 | 35 | 315 | 4 |
| 50 |
 Rodney Hampton |
NYG | 8.56 | 15 | 32 | 274 | 2 |
1–50 of 54Next →