

2018 MLB Third Base Range Factor Leaders
Putouts plus assists per game at third base
Matt Chapman led the majors in third base range factor with 3.20 in 2018, 0.43 ahead of Carlos Sanchez (2.77). It was one of 4 times Matt Chapman led in third base range factor.
Showing players with at least 108 games at the position — the fielding-title rule of two-thirds of the team's games. Show all players
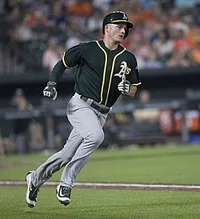 Led all of MLB in 2018
Matt Chapman
Oakland Athletics
3.20
Third Base Range Factor
0.43 clear of Carlos Sanchez
Showing Third Base Range Factor and the stats that give it context
Full stat line
| # | Player | Team | 3B RF | G | PO | A | E |
|---|---|---|---|---|---|---|---|
| 1 |
 Matt Chapman |
OAK | 3.20 | 145 | 133 | 331 | 20 |
| 2 |
 Carlos Sanchez |
CHA | 2.77 | 141 | 137 | 254 | 13 |
| 3 |
 Kyle Seager |
SEA | 2.75 | 154 | 98 | 325 | 14 |
| 4 |
 Nolan Arenado |
COL | 2.74 | 152 | 104 | 312 | 14 |
| 5 |
 Matt Duffy |
TBA | 2.72 | 125 | 87 | 253 | 13 |
| 6 |
 Mike Moustakas |
KCA | 2.69 | 128 | 83 | 261 | 12 |
| 7 |
 Rafael Devers |
BOS | 2.60 | 116 | 57 | 245 | 24 |
| 8 |
 Todd Frazier |
NYN | 2.60 | 109 | 80 | 203 | 12 |
| 9 |
 Jeimer Candelario |
DET | 2.55 | 140 | 116 | 241 | 10 |
| 10 |
 Alex Bregman |
HOU | 2.42 | 136 | 84 | 245 | 13 |
| 11 |
 Eugenio Suarez |
CIN | 2.41 | 143 | 94 | 250 | 19 |
| 12 |
 Maikel Franco |
PHI | 2.40 | 117 | 85 | 196 | 15 |
| 13 |
 Evan Longoria |
SFN | 2.32 | 123 | 72 | 213 | 15 |
| 14 |
 Anthony Rendon |
WAS | 2.28 | 136 | 88 | 222 | 6 |
| 15 |
 Eduardo Escobar |
MIN | 2.24 | 131 | 70 | 224 | 5 |
| 16 |
 Jose Ramirez |
CLE | 2.18 | 137 | 94 | 205 | 11 |
| 17 |
 Colin Moran |
PIT | 2.17 | 116 | 64 | 188 | 10 |
| 18 |
 Johan Camargo |
ATL | 2.05 | 114 | 64 | 170 | 10 |
| 19 |
 Miguel Andujar |
NYA | 1.99 | 136 | 93 | 178 | 15 |