

2000 MLB Walks + Hits / IP Leaders
Baserunners allowed per inning
Pedro Martinez led the majors in walks + hits / ip with 0.74 in 2000, 0.25 ahead of Kevin Brown (0.99). It stands 5th among all single seasons in MLB history. It was one of 6 times Pedro Martinez led in walks + hits / ip.
Showing pitchers with at least 162.0 innings — the standard 1.0 inning per team game. Show all players
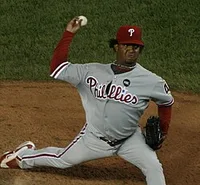 Led all of MLB in 2000
Pedro Martinez
Boston Red Sox
0.74
Walks + Hits / IP
0.25 clear of Kevin Brown
Showing Walks + Hits / IP and the stats that give it context
Full stat line
| # | Player | Team | WHIP | W | ERA | IP | BB |
|---|---|---|---|---|---|---|---|
| 1 |
 Pedro Martinez |
BOS | 0.74 | 18 | 1.74 | 217.0 | 32 |
| 2 |
 Kevin Brown |
LAN | 0.99 | 13 | 2.58 | 230.0 | 47 |
| 3 |
 Greg Maddux |
ATL | 1.07 | 19 | 3.00 | 249.1 | 42 |
| 4 |
 Randy Johnson |
ARI | 1.12 | 19 | 2.64 | 248.2 | 76 |
| 5 |
 Darryl Kile |
SLN | 1.18 | 20 | 3.91 | 232.1 | 58 |
| 6 |
 Curt Schilling |
PHI +1 | 1.18 | 11 | 3.81 | 210.1 | 45 |
| 7 |
 Mike Mussina |
BAL | 1.19 | 11 | 3.79 | 237.2 | 46 |
| 8 |
 Tom Glavine |
ATL | 1.19 | 21 | 3.40 | 241.0 | 65 |
| 9 |
 Jon Lieber |
CHN | 1.20 | 12 | 4.41 | 251.0 | 54 |
| 10 |
 Orlando Hernandez |
NYA | 1.21 | 12 | 4.51 | 195.2 | 51 |
| 11 |
 Al Leiter |
NYN | 1.21 | 16 | 3.20 | 208.0 | 76 |
| 12 | Woody Williams | SDN | 1.23 | 10 | 3.75 | 168.0 | 54 |
| 13 |
 Rick Reed |
NYN | 1.23 | 11 | 4.11 | 184.0 | 34 |
| 14 |
 Tim Hudson |
OAK | 1.24 | 20 | 4.14 | 202.1 | 82 |
| 15 |
 Brian Anderson |
ARI | 1.24 | 11 | 4.05 | 213.1 | 39 |
| 16 |
 Eric Milton |
MIN | 1.25 | 13 | 4.86 | 200.0 | 44 |
| 17 |
 Glendon Rusch |
NYN | 1.26 | 11 | 4.01 | 190.2 | 44 |
| 18 |
 Jeff Weaver |
DET | 1.29 | 11 | 4.32 | 200.0 | 52 |
| 19 |
 Kevin Millwood |
ATL | 1.29 | 10 | 4.66 | 212.2 | 62 |
| 20 |
 David Wells |
TOR | 1.29 | 20 | 4.11 | 229.2 | 31 |
| 21 |
 Rick Ankiel |
SLN | 1.30 | 11 | 3.50 | 175.0 | 90 |
| 22 |
 Kevin Tapani |
CHN | 1.30 | 8 | 5.01 | 195.2 | 47 |
| 23 |
 Roger Clemens |
NYA | 1.31 | 13 | 3.70 | 204.1 | 84 |
| 24 |
 Chan Ho Park |
LAN | 1.31 | 18 | 3.27 | 226.0 | 124 |
| 25 |
 Kris Benson |
PIT | 1.34 | 10 | 3.85 | 217.2 | 86 |
| 26 |
 Mike Hampton |
NYN | 1.35 | 15 | 3.14 | 217.2 | 99 |
| 27 | Armando Reynoso | ARI | 1.35 | 11 | 5.27 | 170.2 | 52 |
| 28 |
 Ryan Dempster |
FLO | 1.36 | 14 | 3.66 | 226.1 | 97 |
| 29 | Garrett Stephenson | SLN | 1.36 | 16 | 4.49 | 200.1 | 63 |
| 30 | Darren Dreifort | LAN | 1.36 | 12 | 4.16 | 192.2 | 87 |
| 31 |
 Livan Hernandez |
SFN | 1.36 | 17 | 3.75 | 240.0 | 73 |
| 32 |
 Paul Abbott |
SEA | 1.36 | 9 | 4.22 | 179.0 | 80 |
| 33 | James Baldwin | CHA | 1.37 | 14 | 4.65 | 178.0 | 59 |
| 34 |
 Brad Radke |
MIN | 1.38 | 12 | 4.45 | 226.2 | 51 |
| 35 |
 Sidney Ponson |
BAL | 1.38 | 9 | 4.82 | 222.0 | 83 |
| 36 | Bryan Rekar | TBA | 1.38 | 7 | 4.41 | 173.1 | 39 |
| 37 | Robert Person | PHI | 1.38 | 9 | 3.63 | 173.1 | 95 |
| 38 | Mike Sirotka | CHA | 1.38 | 15 | 3.79 | 197.0 | 69 |
| 39 | Todd Ritchie | PIT | 1.39 | 9 | 4.81 | 187.0 | 51 |
| 40 |
 Bartolo Colon |
CLE | 1.39 | 15 | 3.88 | 188.0 | 98 |
| 41 |
 Andy Ashby |
PHI +1 | 1.39 | 12 | 4.92 | 199.1 | 61 |
| 42 |
 Denny Neagle |
CIN +1 | 1.39 | 15 | 4.52 | 209.0 | 81 |
| 43 |
 Aaron Sele |
SEA | 1.39 | 17 | 4.51 | 211.2 | 74 |
| 44 |
 Gil Heredia |
OAK | 1.41 | 15 | 4.12 | 198.2 | 66 |
| 45 |
 Javier Vazquez |
MON | 1.42 | 11 | 4.05 | 217.2 | 61 |
| 46 |
 Randy Wolf |
PHI | 1.42 | 11 | 4.36 | 206.1 | 83 |
| 47 |
 Esteban Loaiza |
TEX +1 | 1.43 | 10 | 4.56 | 199.1 | 57 |
| 48 |
 Chuck Finley |
CLE | 1.43 | 16 | 4.17 | 218.0 | 101 |
| 49 | Rick Helling | TEX | 1.43 | 16 | 4.48 | 217.0 | 99 |
| 50 |
 Kirk Rueter |
SFN | 1.45 | 11 | 3.96 | 184.0 | 62 |
1–50 of 87Next →